


Europe
Export to France
Fashion, food and design market. EU rules plus French-language labels; SIAL Paris is a key food fair.
- Capital
- Paris
- Currency
- EUR
- Trade agreement with India
- India–EU Free Trade Agreement (concluded, not yet in force) Not in force yetNot yet in force (talks concluded 27 Jan 2026)
- Main ports
- Le Havre, Marseille-Fos, Paris Charles de Gaulle Airport
France buys Indian garments, home textiles, leather goods, footwear, jewellery, chemicals, machinery parts and marine products. Buyers care about design, finish and sustainability claims. All EU rules apply, and consumer labels and instructions must be in French.
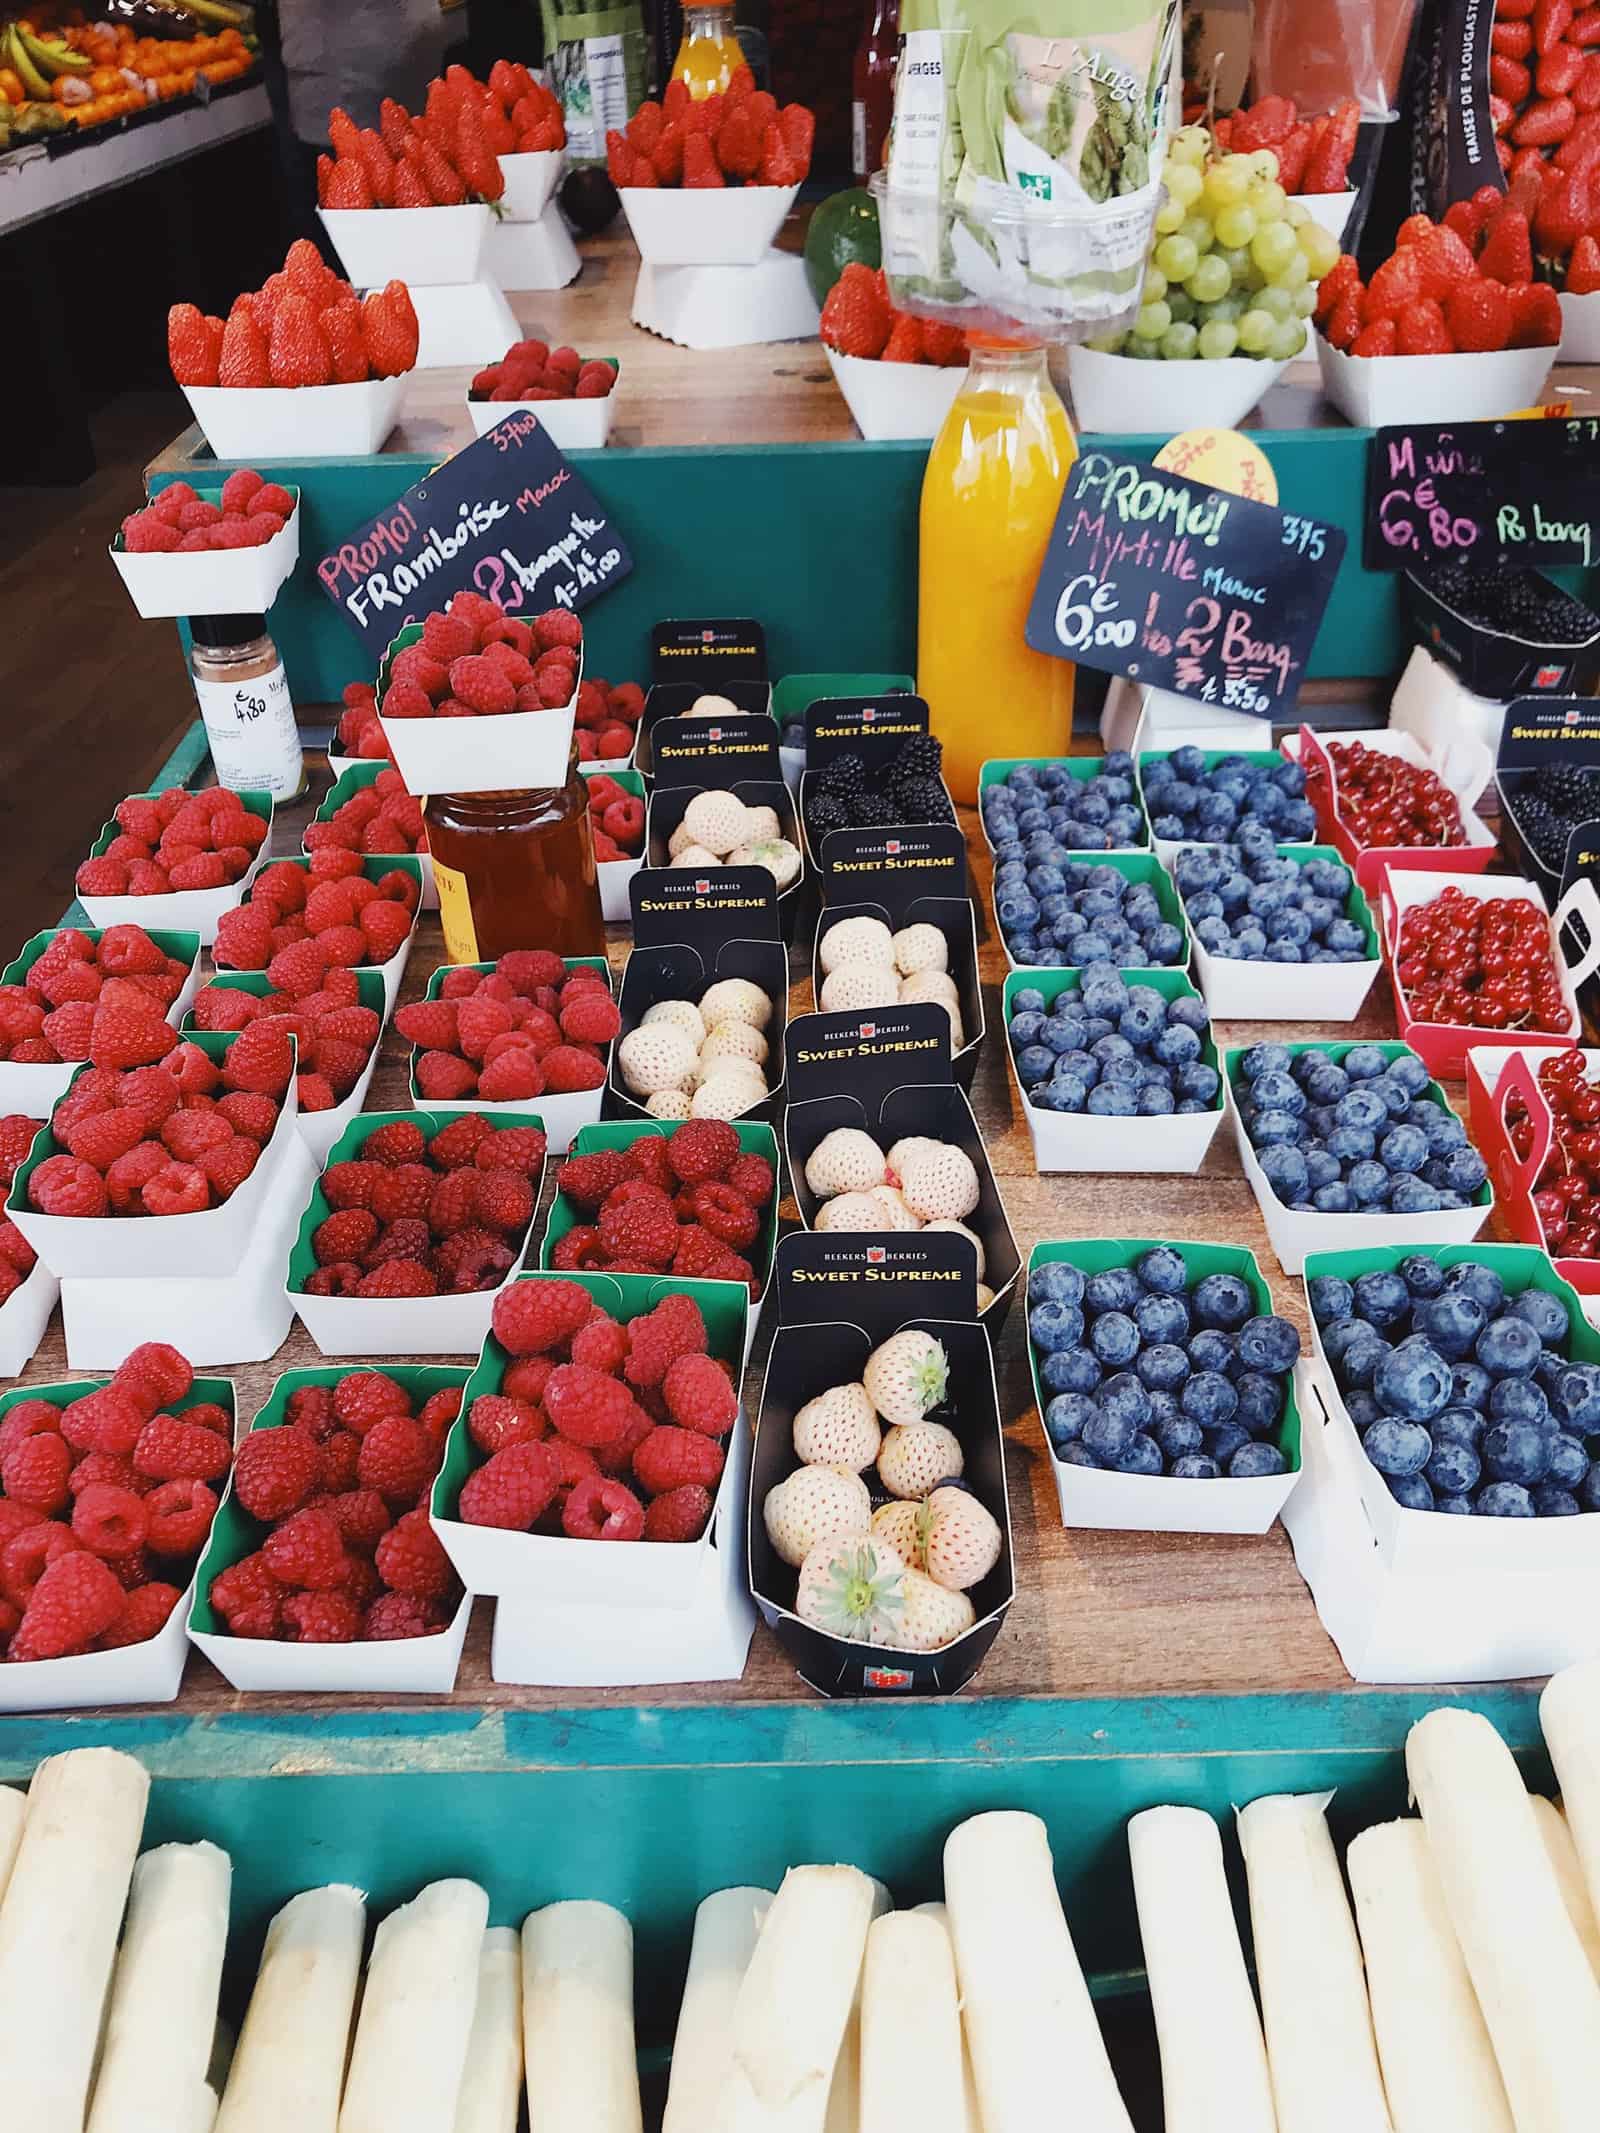
France trades with India under EU rules. The India–EU FTA was concluded on 27 January 2026; the Commerce Minister said in June 2026 that signing was expected by December 2026 and entry into force around early 2027. Until then, normal EU duties apply. Confirm current status on commerce.gov.in.
What it buys from India
- Garments, home textiles and footwear
- Leather goods, jewellery and handicrafts
- Machinery, electrical goods and chemicals
- Marine products, spices and tea
Import rules on their side
- All EU rules apply — MRLs for food, REACH for chemicals in products, CE marking, CBAM data for steel and aluminium, and the EUDR for leather, coffee, wood and rubber from 30 December 2026 for large and medium importers.
- Consumer labels, instructions and warranties must be in French.
- Textiles and footwear sold in France must carry recycling and environmental information required by French law; ask your buyer for their label template.
Practical tips
- SIAL Paris (food, held in even-numbered years) and Maison&Objet (home and design) are the key fairs.
- French buyers value a polished catalogue and communication in French; a French-speaking agent helps.
- August is the main holiday month — orders and replies slow down sharply.
Sources (9)
- Department of Commerce — India-EU Free Trade Agreement concluded (27 Jan 2026)
- All India Radio News — India-EU likely to sign FTA by December: Piyush Goyal (21 Jun 2026)
- European Commission — Access2Markets (EU tariffs and import rules by product)
- European Commission — EU pesticides database (maximum residue levels)
- European Commission — Regulation on deforestation-free products (EUDR)
- European Commission — Carbon Border Adjustment Mechanism (CBAM)
- SIAL Paris
- French Customs (Douane)
- Department of Commerce — TradeStat export-import data bank
Trade data
India’s exports to France in numbers
From the Department of Commerce’s TradeStat (Indian financial years, April–March), the country’s imports from the world from UN Comtrade, and its basics from the World Bank.
- India’s exports here, 2025-26
- US$ 7.1 bn No. 13 of our 30 countries
- Change from 2024-25
- ↓ -10.8% US$ 7.96 bn → US$ 7.1 bn
- Share of all Indian exports
- 1.61%
- Its imports from the world
- US$ 762 bn 2024 · India’s share 1.42%
What India sells here most
By HS chapter, 2025-26. Change is against 2024-25.
What is rising and what is falling
Chapters where India sells at least US$ 5 million. Change from 2024-25 to 2025-26.
↑ High demand
- Iron and steelUS$ 40.4 mn → US$ 114 mn↑+182.4%
- TobaccoUS$ 20.7 mn → US$ 36.5 mn↑+76.3%
- Inorganic chemicalsUS$ 29.2 mn → US$ 42.3 mn↑+44.9%
- AluminiumUS$ 59.5 mn → US$ 83.3 mn↑+40.1%
- Instruments, medical devicesUS$ 249 mn → US$ 313 mn↑+25.4%
- Other chemical productsUS$ 112 mn → US$ 140 mn↑+24.8%
- Fish and seafoodUS$ 75.6 mn → US$ 88.6 mn↑+17.2%
- MachineryUS$ 697 mn → US$ 811 mn↑+16.4%
↓ Low demand
- Fuels and petroleum productsUS$ 1.14 bn → US$ 198 mn↓-82.7%
- AircraftUS$ 747 mn → US$ 303 mn↓-59.5%
- Animal feed and food residuesUS$ 92.9 mn → US$ 55.3 mn↓-40.4%
- Fats and oilsUS$ 87.5 mn → US$ 70.2 mn↓-19.7%
- FootwearUS$ 123 mn → US$ 105 mn↓-14.1%
Opportunity: what this country buys from the world, and from India
The country’s own recorded imports in UN Comtrade, 2024. Chapters with the biggest gap between what it buys from the world and what it buys from India.
Our product guides that sell here
India’s exports of each product to this country, 2025-26.
The 20 biggest export lines
4-digit HS lines, 2025-26, with their Harmonized System descriptions.
What India buys from France
India’s imports from this country in 2025-26 by HS chapter, from TradeStat — this country can be your supplier too.
- India’s imports, 2025-26
- US$ 8.67 bn US$ 7.23 bn → US$ 8.67 bn
- India’s exports, 2025-26
- US$ 7.1 bn
- Trade balance
- −US$ 1.57 bn exports minus imports
- Change in imports
- +19.9%
The country at a glance
- Population
- 68.7 mn 2025
- GDP
- US$ 3,366.3 bn 2025
- GDP per person
- US$ 48,986 2025
- Imports (goods and services)
- US$ 1,137.8 bn 2025
Sources: TradeStat — Export Import Data Bank, Department of Commerce · UN Comtrade database (United Nations Statistics Division) · World Bank — World Development Indicators · Figures taken 29 October 2026.
What to send to France
All products → Free to exportTextiles & apparelReadymade garmentsKnitted and woven clothing for brands and retailers; the USA, UK, UAE and the EU are the big buyers.HS6109.10Exports 2025-26US$ 15.8 bn ↓1.2%
 Free to exportTextiles & apparelHome textiles (bed, bath and kitchen linen)Bedsheets, towels and kitchen linen for retailers; the USA buys more than half of India's exports.HS6302Exports 2025-26US$ 2.01 bn ↓5.7%
 Free, with conditionsLeather & footwearLeather goods (bags, wallets, belts)Leather handbags, wallets and travel goods for brands; the USA and Europe buy most.HS4202Exports 2025-26US$ 1.59 bn ↓1.8%
 Free to exportLeather & footwearFootwearLeather shoes, sandals and boots from Agra, Kanpur and Tamil Nadu; the USA, UK and Germany lead.HS6403Exports 2025-26US$ 1.69 bn ↓4.7%
 Free to exportJewelleryImitation (fashion) jewelleryFashion and costume jewellery for boutiques and online sellers; the USA, UK, France and Spain lead.HS7117Exports 2025-26US$ 132 mn ↓3.5%
 Free to exportHandicraftsHandicrafts (cane, bamboo, jute and natural fibre)Baskets, storage, lamps and décor from cane, bamboo and grasses, sold to home-décor importers.HS4602Exports 2025-26US$ 23.3 mn ↓20.7%
 Free to exportMarineFrozen shrimpIndia’s top seafood export. Needs MPEDA registration and an EIC-approved plant; residue testing and US trade measures shape the business.HS0306.17Exports 2025-26US$ 5.61 bn ↑9.1%
 Free to exportFarm produceSpicesWhole, ground and blended spices. Spices Board registration (CRES) is compulsory; residue and ethylene oxide tests keep buyers.HS0904–0910Exports 2025-26US$ 3.12 bn ↓5.1%
More in Europe
 CETAGBPLondonUnited KingdomNew CETA in force since July 2026 — most Indian goods now enter duty-free. Strong market for garments, food and engineering.From India 2025-26US$ 13.4 bn
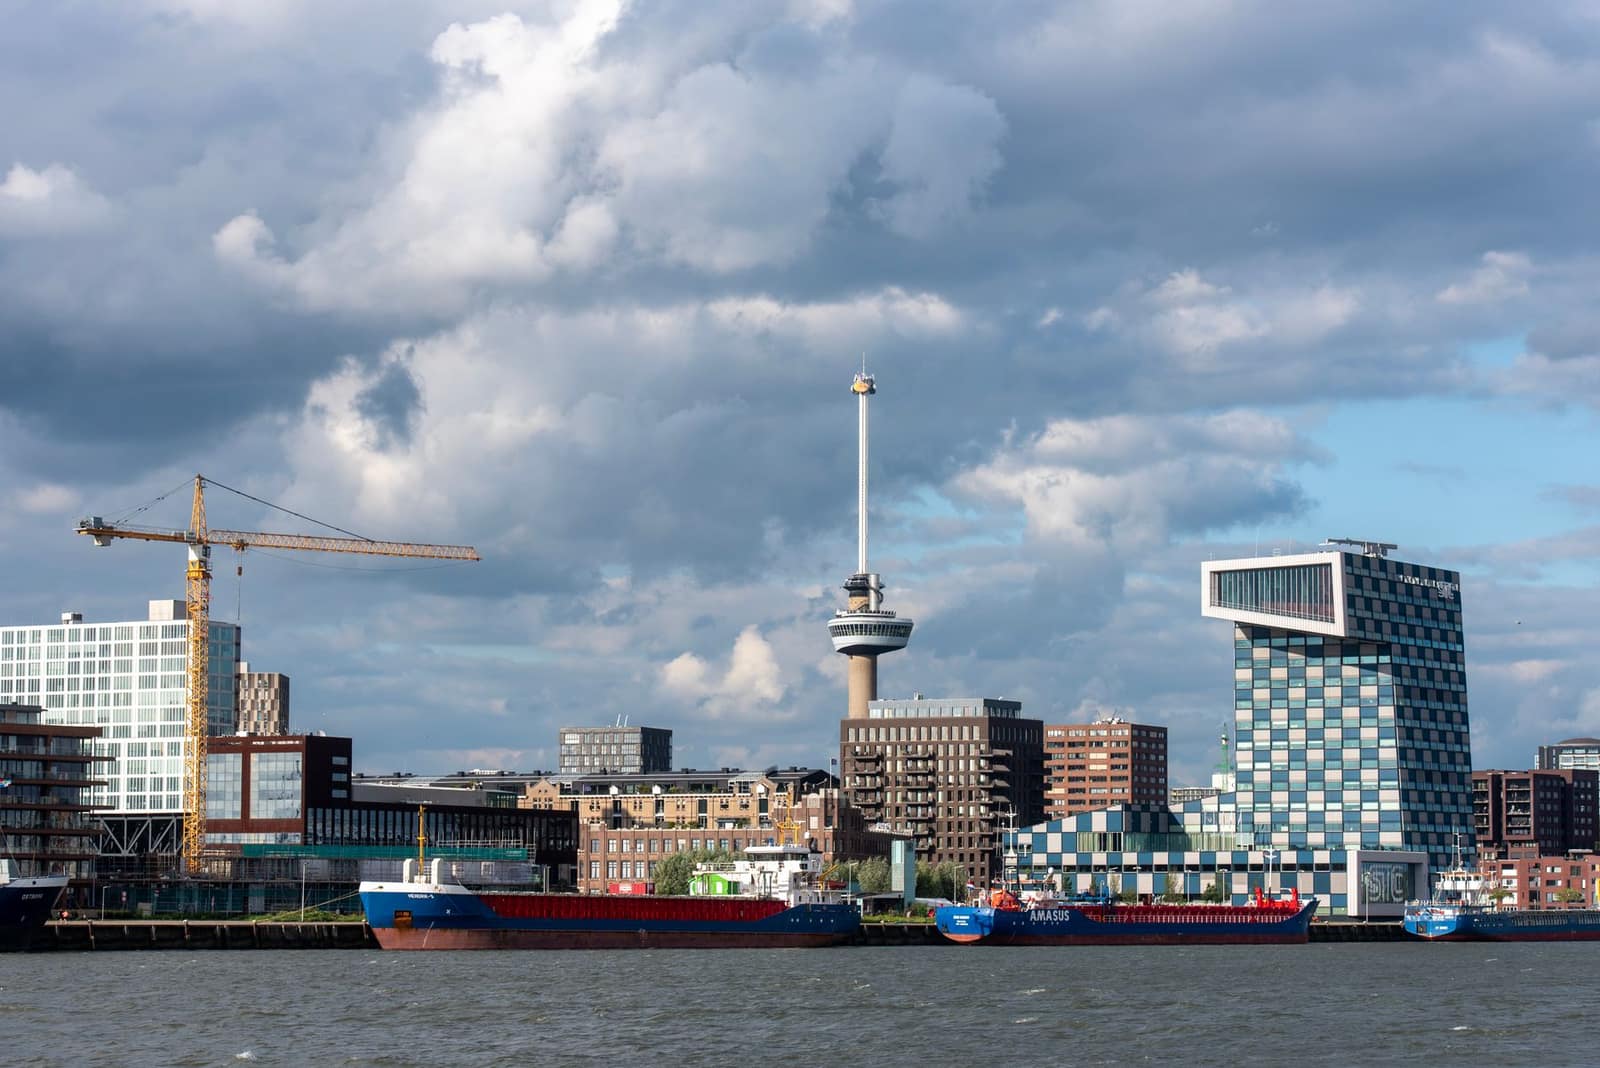 EURAmsterdamNetherlandsEurope's main gateway: Rotterdam handles goods for the whole EU. EU food-safety and residue rules apply.From India 2025-26US$ 17.5 bn
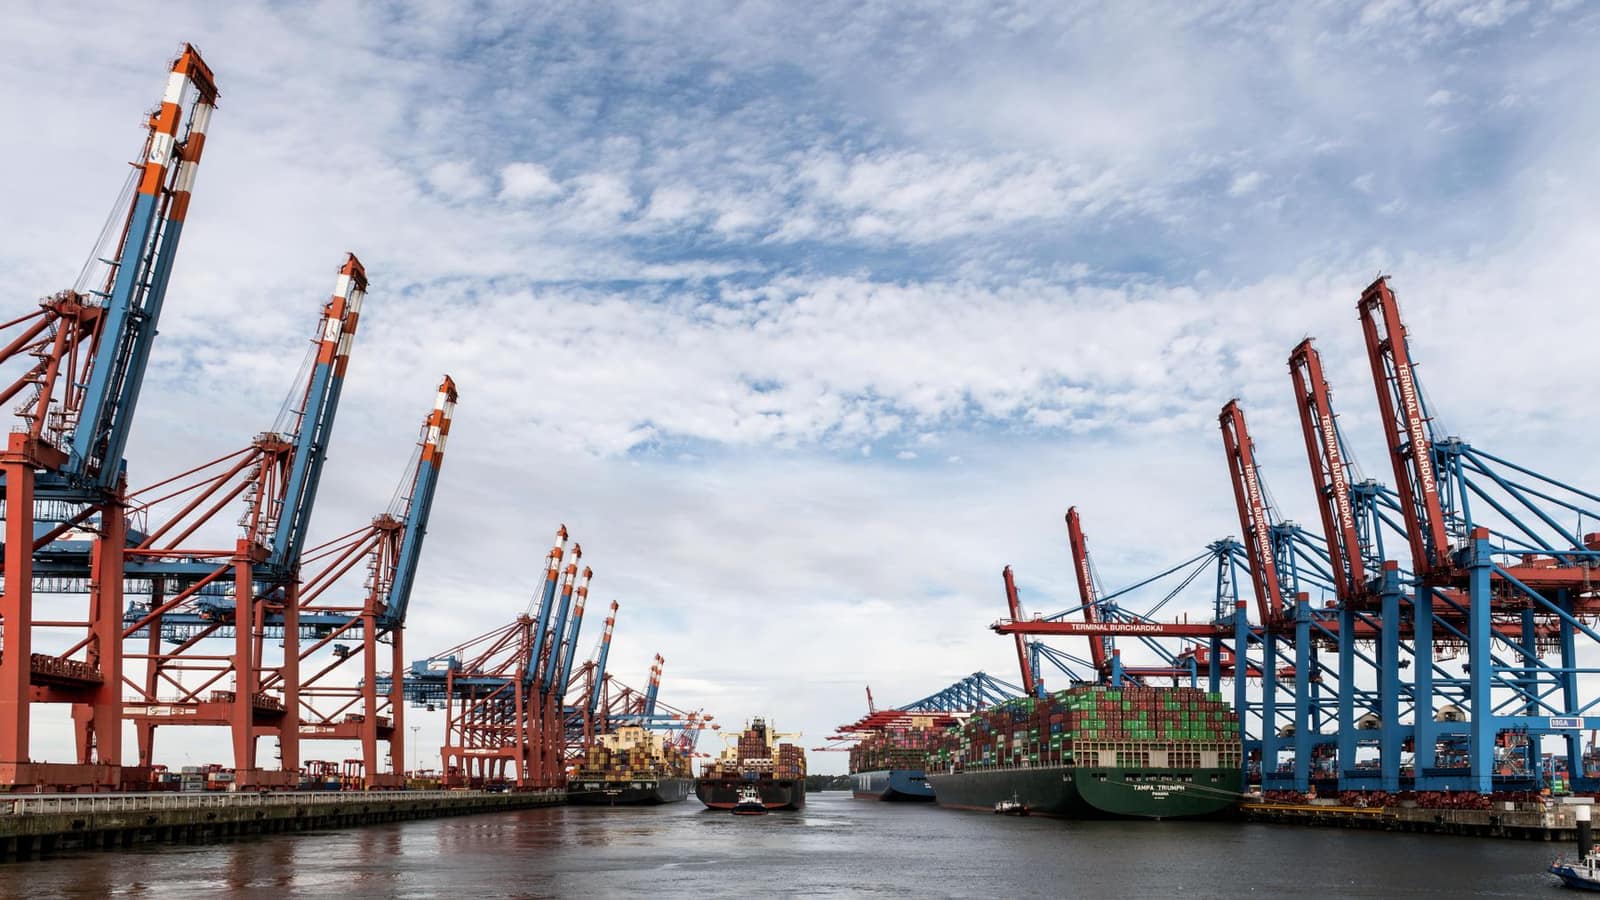 EURBerlinGermanyEurope's largest economy and India's biggest EU partner. Values quality, certificates and supply-chain transparency.From India 2025-26US$ 11.5 bn
 EURRomeItalyManufacturing buyer of Indian leather, yarn, castings, chemicals and seafood. EU rules apply.From India 2025-26US$ 7.79 bn