


Leather & footwear
Export footwear
Leather shoes, sandals and boots from Agra, Kanpur and Tamil Nadu; the USA, UK and Germany lead.
- HS code
- 6403 Footwear with uppers of leather (HS 6403). Footwear with textile uppers is 6404, rubber or plastic footwear 6401–6402, and parts 6406.
- Export policy
- Free to export Free to export under ITC(HS) Schedule 2.
- Registrations
- 3 IEC, GST and those below
- India’s exports, 2025-26
- US$ 1.69 bn to 146 countries
What is exported
India makes leather shoes, sandals and boots in Agra, Kanpur, Ambur–Vaniyambadi, Chennai and Kolkata, as well as non-leather and sports footwear. Buyers are brands and importers who supply lasts and specifications. In 2025-26 India exported about US$ 1.7 billion under HS 6403; the USA led, followed by the UK, Germany, the Netherlands, Italy and Spain.


Varieties, grades and forms
- Leather shoes for men and womenFormal and casual shoes with leather uppers — India's main footwear export.
- Leather sandals and chappalsIncluding Kolhapuri chappals, sold to fashion and ethnic-wear retailers.
- Safety footwearLeather boots with steel or composite toe caps for industrial buyers; must meet safety standards such as EN ISO 20345.
- Non-leather footwear (textile or synthetic uppers)Sports shoes, canvas shoes and slippers (HS 6402, 6404) — a fast-growing line.
- Shoe uppers and componentsStitched uppers sent to factories abroad for finishing.
Where it is grown or made
- Tamil NaduChennai, Ambur, Vaniyambadi and Ranipet
- Uttar PradeshAgra (leather shoes) and Kanpur (leather and safety footwear)
- Maharashtra and KarnatakaKolhapur, Sangli and Belagavi region — Kolhapuri chappals
- HaryanaBahadurgarh — non-leather and sports footwear
- PunjabJalandhar — leather footwear
The quality buyers ask for
- Restricted chemicals
- Chromium VI below 3 mg/kg in leather parts (EU REACH), azo amines, PAHs, DMFu ban and the brand's restricted list
- Sole adhesion and flexing
- Upper-to-sole bond strength and flex resistance using EN ISO or SATRA methods
- Abrasion and slip
- Outsole abrasion and slip resistance (EN ISO 13287) for work and casual shoes
- Safety footwear
- EN ISO 20345 (toe cap 200 J, S1–S5 classes) for the EU; ASTM F2413 for the USA
- Sizing
- Size charts by market (EU, UK, US) and width fittings; last approved by the buyer
- Colour fastness
- Rubbing fastness of uppers and linings, so socks and feet are not stained
Certificates
- Chemical and physical test reportsRequiredRequired by virtually every brand before shipment approval.
- Social compliance audit (amfori BSCI, SMETA or SA8000)RequiredRequired by most brands for the factory and key job-work units.
- CE (PPE Regulation 2016/425)Often askedSafety shoes sold in the EU need EU type-examination by a notified body and CE marking.
- Leather Working Group (LWG)Often askedMany brands require leather from LWG-rated tanneries.
- ISO 9001Often askedQuality system; common in larger export units.
Shipping, storage and shelf life
Each pair in a shoe box with tissue and stuffing, boxes in export cartons (often 6–12 pairs). Loaded by volume in 20-ft, 40-ft or 40-ft high-cube containers.
Sea from Chennai, Nhava Sheva or ICDs near Agra and Kanpur; air for samples and urgent lots.
Keep dry; leather shoes mould in damp storage. Use allowed anti-mould sachets and silica gel.
What goes on the pack and carton
- EU: material label for upper, lining and sock, and outsole, using the pictograms or words of Directive 94/11/EC.
- Country of origin on the shoe or box ('Made in India').
- Size in the market's system, article number and barcode on the box.
- Safety shoes: CE mark, standard number, protection class (for example S3) and size marked on the shoe.
The Footwear Design and Development Institute (FDDI) runs NABL-accredited footwear testing labs at several campuses, including Noida, Chennai and Agra region centres. CSIR-CLRI, Chennai, tests leather. For safety footwear, the EU notified body may test abroad or through an Indian partner lab; search the NABL directory under 'footwear'.
Benefits of exporting this product
- RoDTEP: 1.2% of FOB
Tariff item 6403 59 10 (leather footwear with leather soles, for men) earns 1.2% of FOB value, with no rupee cap, as a duty credit scrip on ICEGATE. All HS 6403 lines, including Kolhapuri chappals (6403 20 40), carry 1.2% with no cap. These rates continue to 31 Dec 2026 (DGFT Notification 41/2026-27). Confirm your exact 8-digit line on the DGFT RoDTEP page before you price an order.
DGFT — Appendix 4R, RoDTEP schedule for DTA exports w.e.f. 10.10.2024 (Notification 32/2024-25); rates continued to 31.12.2026 by Notification 41/2026-27 ↗ - Duty drawback: 6.1% of FOB
Drawback item 640305 (leather shoes for adults, other than boots) has an All Industry Rate of 6.1% of FOB, capped at ₹149.7 per pair, paid into your bank account. It is not available on exports under Advance Authorisation or from EOU/SEZ units. Leather sandals and chappals (640309) get 6.1%, capped at ₹107.1 per pair; leather safety footwear with metal toe cap (640311) gets 9.0%, capped at ₹193.6 per pair. Check the current schedule on the CBIC drawback page before shipping.
Gazette of India — Notification 77/2023-Customs (N.T.) dated 20.10.2023: All Industry Rates of duty drawback, in force from 30.10.2023 ↗ - Registered GI tags
Kolhapuri Chappal (Maharashtra and Karnataka) and Agra Leather Footwear (Uttar Pradesh) are registered Geographical Indications. Only registered producers and authorised users may sell under these names, which helps genuine makers stand out and fetch a better price.
IP India (Geographical Indications Registry) — Registration details of Geographical Indications ↗ - Zero duty into the UK (CETA)
The India-UK CETA came into force on 15 July 2026 and gives zero-duty access to nearly 99% of India's exports; the Commerce Ministry named leather among the sectors that gain. Claim it with a CETA certificate of origin and check the line for your code on the UK Trade Tariff.
PIB — India-UK CETA enters into force (15 Jul 2026): zero-duty access for nearly 99% of India's exports ↗
Where to register
- CLE (Council for Leather Exports)RCMC for leather footwear and footwear components.leatherindia.org ↗
Quality and checks
- EU: footwear labelling of upper, lining and sole materials; REACH limits on chromium VI and restricted chemicals.
- Physical tests the buyer specifies: sole bond strength, flexing, colour rub-off.
- EU Deforestation Regulation data on cattle leather, for EU buyers.
Work with an Agra or Kanpur unit that already makes export-grade shoes. Choose one style family (for example sandals), join CLE, and meet buyers at CLE pavilions; expect several sampling rounds before a first order.
Where new exporters go wrong
- Size grading errors between sample and bulk; check every size before packing.
- Sole separation or cracking found after sale — leads to chargebacks.
- Late delivery for seasonal ranges; a missed season usually means a cancelled order.
Documents this product needs
Schemes that apply
- RoDTEP Remission of Duties and Taxes on Exported Products
- Drawback Duty Drawback (All Industry Rates)
- Advance Authorisation Advance Authorisation
- EPCG Export Promotion Capital Goods Scheme
- ECGC ECGC export credit insurance for small exporters
- LUT Letter of Undertaking for zero-rated exports under GST
- Districts as Export Hubs Districts as Export Hubs
Sources (6)
- Department of Commerce, Export Import Data Bank — India's exports of HS 6403 by country, 2025-26
- DGFT — Appendix 2T: Export Promotion Councils and the products under each
- DGFT — ITC(HS) export policy search (Schedule 2)
- European Chemicals Agency — Understanding REACH
- European Commission — EU Deforestation Regulation (application dates and scope)
- Council for Leather Exports — official site
Trade data
Indian footwear exports in numbers
From the Department of Commerce’s TradeStat, country by country. US$, Indian financial years (April–March).
- Exports in 2025-26
- US$ 1.69 bn +5.1% a year on average, 2020-21 to 2025-26
- Change from 2024-25
- ↓ -4.7% US$ 1.78 bn → US$ 1.69 bn
- Buyer countries
- 146
- Average export price
- US$ 16.10 per kg · 1,05,207 tonnes shipped · US$ 15.67 the year before
The price cycle
India’s average export price per kg each year (total value ÷ total quantity). Highest in 2022-23, lowest in 2020-21 — a 14% swing between them. Keep this swing in mind when you quote.
What next: a projection from the trend
The past trend carried forward — not a forecast by any authority. Sudden changes in policy, prices or demand are not in it.
Likely range US$ 1.55 bn to US$ 2.56 bn.
- Trend
- +3% a year
- Fit (R²)
- 0.12 — weak, read with care
- Based on
- 6 years of official figures
Method: a straight line through the logarithm of yearly exports (log-linear regression); range = ±1 standard error.
Biggest buyer countries
By value in 2025-26. Change is against 2024-25.
Where demand is rising and falling
Only countries that buy at least US$ 1 million or 1% of India’s exports of this product. Change from 2024-25 to 2025-26.
↑ High demand
- HungaryUS$ 13.2 mn → US$ 19.2 mn↑+46%
- United Arab EmiratesUS$ 46.8 mn → US$ 58.8 mn↑+25.6%
- NetherlandsUS$ 116 mn → US$ 131 mn↑+12.1%
↓ Low demand
Which forms sell, and at what price
India’s exports by 8-digit tariff line, 2025-26. Average price = total value ÷ total quantity (TradeStat): the average of every shipment on that line, not the price of any one deal.
| Tariff line | Value 2025-26 | Change | Quantity | Average price |
|---|---|---|---|---|
Other sport ftwr with outer soles of rubber6403 19 20 · Sports footwear,, with outer soles of rubber, plastics, leather or composition leather and uppers of leather | US$ 297 mn | ↓-6.1% | 22.7 mn pairs | US$ 13.07 per pairwas US$ 13.20 |
Lthr footwear of plstc and synthtc sole6403 91 20 · Footwear in heading no. 6403, covering the ankle, outer soles of rubber, plastics or composition leather… | US$ 244 mn | ↓-2.7% | 12.0 mn pairs | US$ 20.35 per pairwas US$ 19.74 |
Footwear in heading no. 6403, covering the ankle, outer soles of rubber, plastics or composition leather… — lthr ftwear of other sole6403 91 90 | US$ 233 mn | ↓-2.3% | 12.5 mn pairs | US$ 18.63 per pairwas US$ 17.61 |
Lthr boots and other footwear with rubr sole6403 91 10 · Footwear in heading no. 6403, covering the ankle, outer soles of rubber, plastics or composition leather… | US$ 220 mn | ↑+18.6% | 10.2 mn pairs | US$ 21.59 per pairwas US$ 21.49 |
Lthr sandals with other sole6403 99 90 · Footwear in heading no. 6403,, outer soles of rubber, plastics or composition leather, uppers of leather | US$ 194 mn | ↓-14.1% | 14.8 mn pairs | US$ 13.06 per pairwas US$ 12.85 |
Ankle cvrd all lthr shoes for men6403 51 11 · Footwear in heading no. 6403, with outer soles and uppers of leather, covering the ankle | US$ 129 mn | ↓-17.2% | 5.7 mn pairs | US$ 22.59 per pairwas US$ 22.59 |
Other ftwear incrprtng prtcve metl toe-cap6403 40 00 · Footwear, with metal toe-cap, outer soles of rubber, plastics, leather or composition leather, uppers of… | US$ 126 mn | ↑+12.3% | 10.4 mn pairs | US$ 12.09 per pairwas US$ 11.09 |
Leather sandals with plastc/synthtc sole6403 99 20 · Footwear in heading no. 6403,, outer soles of rubber, plastics or composition leather, uppers of leather | US$ 75.6 mn | ↓-9.5% | 5.8 mn pairs | US$ 13.09 per pairwas US$ 12.71 |
Ankle cvrd all lthr shoes for women6403 51 12 · Footwear in heading no. 6403, with outer soles and uppers of leather, covering the ankle | US$ 54.4 mn | ↑+0.1% | 2.5 mn pairs | US$ 22.09 per pairwas US$ 20.67 |
Leather sandals with rubber sole6403 99 10 · Footwear in heading no. 6403,, outer soles of rubber, plastics or composition leather, uppers of leather | US$ 44.6 mn | ↓-19.5% | 3.0 mn pairs | US$ 14.89 per pairwas US$ 14.19 |
Ankle cvrd all lthr shoes for chldrn6403 51 13 · Footwear in heading no. 6403, with outer soles and uppers of leather, covering the ankle | US$ 24.2 mn | ↓-0.9% | 1.9 mn pairs | US$ 12.93 per pairwas US$ 12.59 |
Other ftwear with outer sole of lthr for men6403 59 10 · Footwear in heading no. 6403,, outer soles and uppers of leather | US$ 16.7 mn | ↓-42.8% | 1.0 mn pairs | US$ 16.08 per pairwas US$ 16.37 |
Other ftwr with outr sole of lthr for women6403 59 20 · Footwear in heading no. 6403,, outer soles and uppers of leather | US$ 12.5 mn | ↓-36.7% | 835k pairs | US$ 15.01 per pairwas US$ 16.10 |
Others-of-ftwear with outr soles of rubr,plstcs, with uppers of leather6403 19 90 · Sports footwear,, with outer soles of rubber, plastics, leather or composition leather and uppers of leather | US$ 7.2 mn | ↓-11.1% | 424k pairs | US$ 17.08 per pairwas US$ 13.40 |
The world market
Each country’s own recorded exports and imports in UN Comtrade, 2023 (the latest year nearly every country has reported).
- World imports
- US$ 56.7 bn 2023
- India among exporters
- #8 of 149 countries
- India’s share of world exports
- 3.3% US$ 1.84 bn
- Left for others to win
- US$ 53.7 bn exported by other countries
Top exporters — your competitors
- 1ItalyUS$ 8.94 bn 16.1%
- 2ChinaUS$ 8.49 bn 15.3%
- 3Viet NamUS$ 7.07 bn 12.7%
- 4GermanyUS$ 4.85 bn 8.7%
- 5FranceUS$ 2.99 bn 5.4%
- 6IndonesiaUS$ 2.98 bn 5.4%
- 7NetherlandsUS$ 2.44 bn 4.4%
- 8IndiaUS$ 1.84 bn 3.3%
- 9PortugalUS$ 1.69 bn 3.1%
- 10SpainUS$ 1.67 bn 3%
Biggest buyers in the world
- 1USAUS$ 11.5 bn 20.4%
- 2GermanyUS$ 5.65 bn 10%
- 3FranceUS$ 4.14 bn 7.3%
- 4ItalyUS$ 3.38 bn 6%
- 5ChinaUS$ 2.97 bn 5.2%
- 6NetherlandsUS$ 2.74 bn 4.8%
- 7United KingdomUS$ 2.25 bn 4%
- 8PolandUS$ 1.89 bn 3.3%
- 9SpainUS$ 1.62 bn 2.9%
- 10Rep. of KoreaUS$ 1.6 bn 2.8%
Opportunity: what these countries buy from the world, and from India
Each country’s own recorded imports in UN Comtrade, latest year it has reported. The long light part of each bar is demand other countries are filling today.
TradeStat’s 2023-24 quantities are double-counted, so that year is left out of the price. Sources: TradeStat — Export Import Data Bank, Department of Commerce · UN Comtrade database (United Nations Statistics Division) · Figures taken 29 October 2026.
Step by step
How to export footwear
India is the world's second-largest footwear producer, after China, though most of its output is sold at home. In exports, China, Vietnam and Indonesia lead by far, with Italy strong in premium shoes. India's export strength is leather footwear from Agra, Kanpur, Chennai, Ambur and Vaniyambadi, and a growing non-leather segment. Demand comes from European and US brands looking to diversify sourcing, and openings are in leather casual and formal shoes, safety footwear, and sandals and chappals for mid-price brands.
- 01Last and pattern
Agree the last and size grading with the buyer; cut patterns.
- 02Sample rounds
Make fit, salesman and confirmation samples; get written approvals.
- 03Material testing
Test leather, soles, adhesives and finished shoes before bulk.
- 04Production
Cut, close uppers, last, sole and finish with inline checks.
- 05Final inspection
AQL inspection on pairing, sizes, bonding, colour and box labels.
- 06Ship
Pack by the buyer's assortment, file the shipping bill, claim RoDTEP and drawback.
- 07Payment
LC or documents against payment; for open account use ECGC cover.
Meet buyers
Trade fairs
- February and September (next: 21–23 February 2027)MICAM MilanoMilan, Italymicam.it ↗
- January and June — check datesExpo Riva SchuhRiva del Garda, Italyexporivaschuh.it ↗
- October (2026 edition: 3–5 October)Meet at AgraAgra, Indiameetatagra.com ↗
- Usually late January to February — check with CLEIndia International Leather Fair (IILF)Chennai, Indialeatherindia.org ↗
Questions
Questions about exporting footwear
What are the EU footwear labelling pictograms?
Can I export safety shoes without CE?
What causes sole separation complaints?
Which council helps footwear exporters?
Is there a minimum order for shoes?
Sources (7)
- CLE (Council for Leather Exports) — official site
- EUR-Lex — Directive 94/11/EC on labelling of the materials used in footwear
- ECHA — substances restricted under REACH (Annex XVII list with conditions)
- Footwear Design and Development Institute (FDDI) — testing laboratories
- CSIR-Central Leather Research Institute (CLRI), Chennai
- European Commission — CE marking
- NABL — search for accredited testing laboratories
Who buys Indian footwear
All countries → USDWashington, D.C.United States of AmericaIndia's largest single-country export market. Strict FDA rules for food; extra 10% US duty on most goods since July 2026.From India 2025-26US$ 87.3 bn
 CETAGBPLondonUnited KingdomNew CETA in force since July 2026 — most Indian goods now enter duty-free. Strong market for garments, food and engineering.From India 2025-26US$ 13.4 bn
 EURBerlinGermanyEurope's largest economy and India's biggest EU partner. Values quality, certificates and supply-chain transparency.From India 2025-26US$ 11.5 bn
 EURAmsterdamNetherlandsEurope's main gateway: Rotterdam handles goods for the whole EU. EU food-safety and residue rules apply.From India 2025-26US$ 17.5 bn
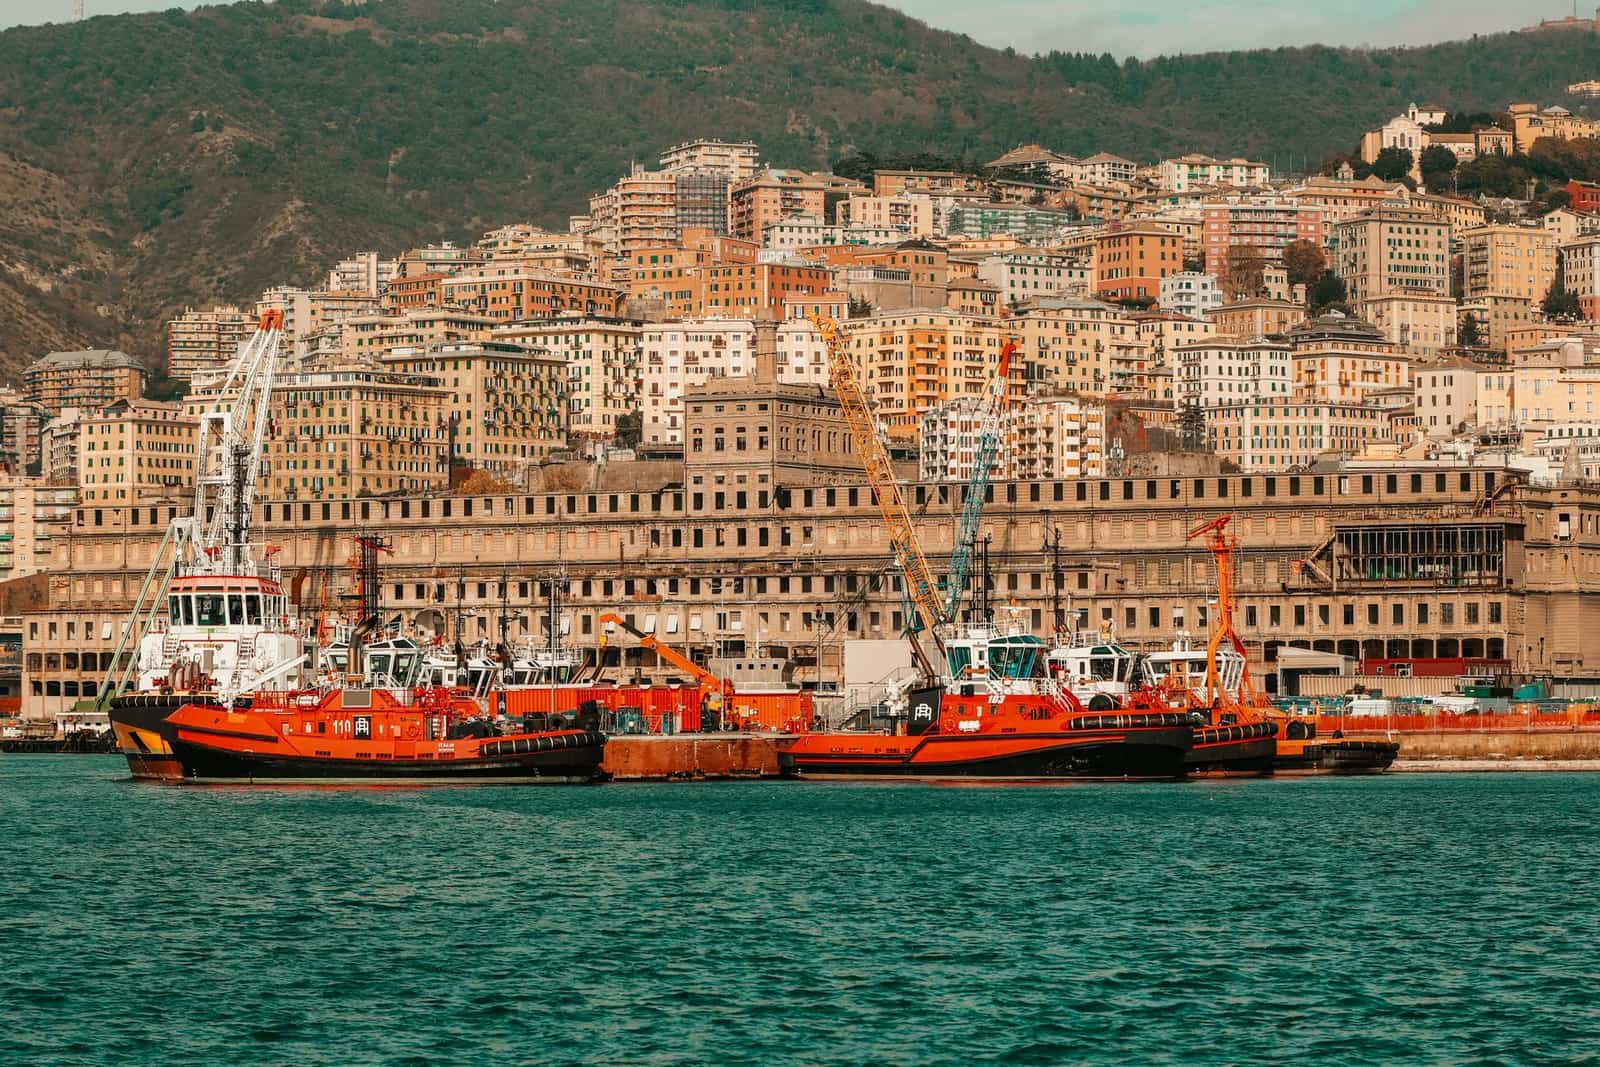 EURRomeItalyManufacturing buyer of Indian leather, yarn, castings, chemicals and seafood. EU rules apply.From India 2025-26US$ 7.79 bn
 EURMadridSpainGrowing EU buyer of Indian garments, seafood, chemicals and auto parts; Valencia and Algeciras are key ports.From India 2025-26US$ 6.96 bn
 EURParisFranceFashion, food and design market. EU rules plus French-language labels; SIAL Paris is a key food fair.From India 2025-26US$ 7.1 bn
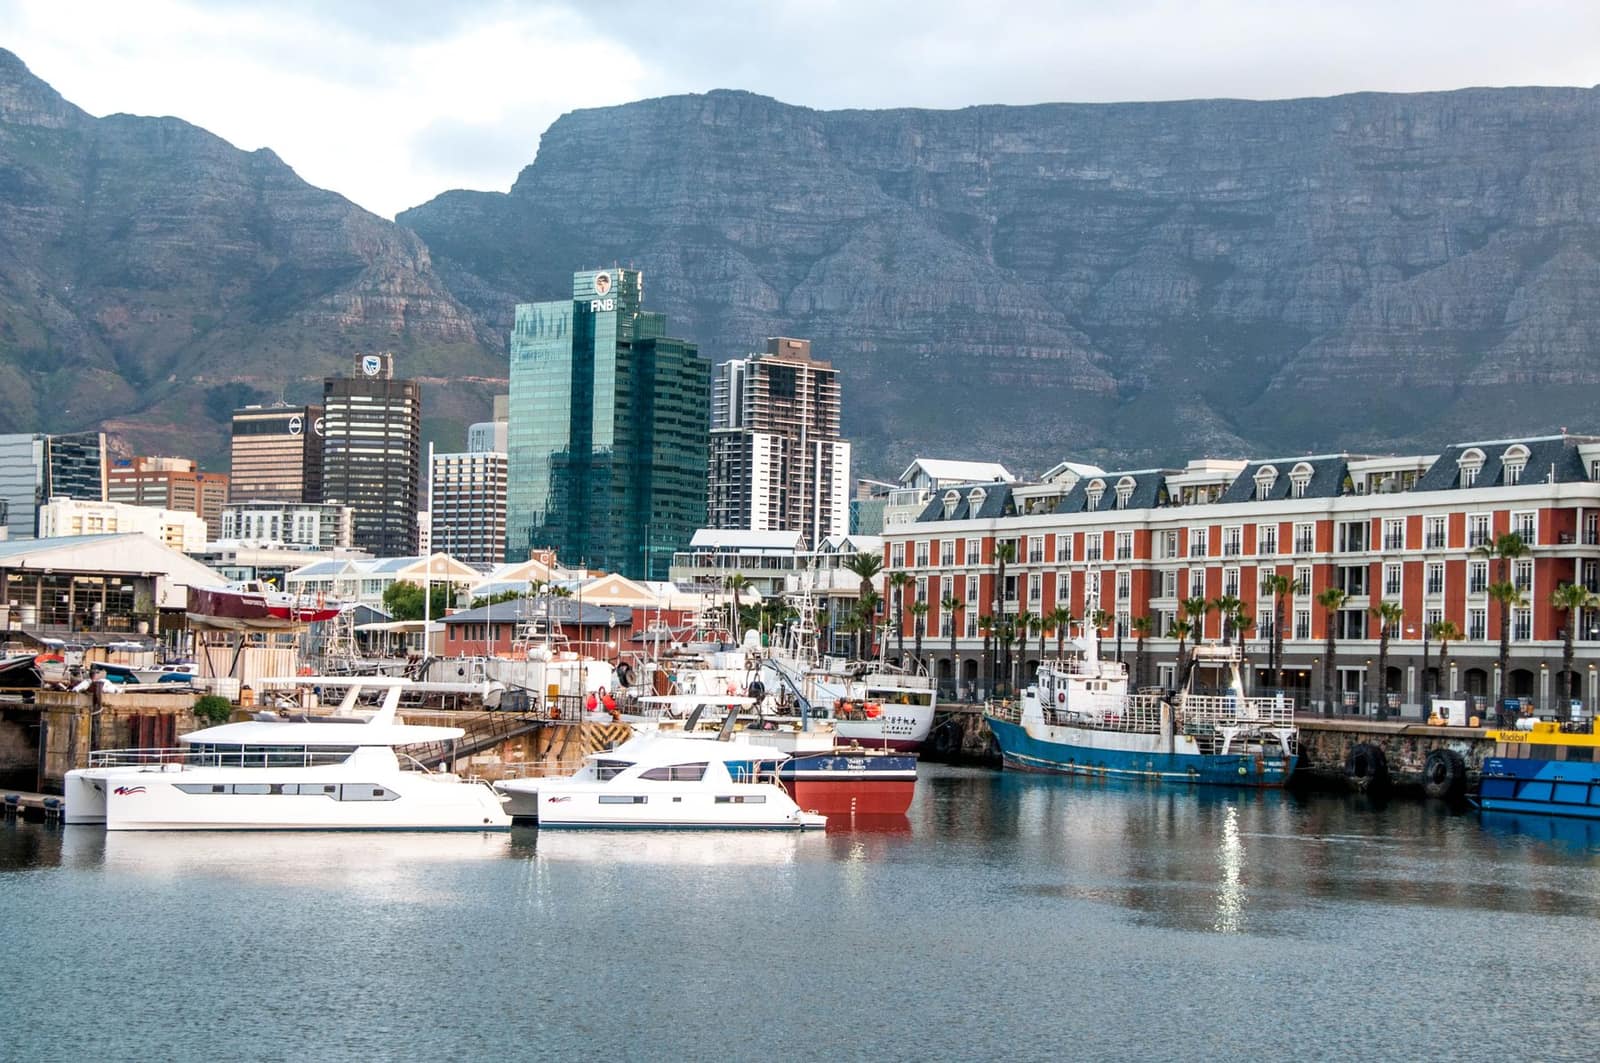 ZARPretoria (executive capital)South AfricaAfrica's most industrial economy. Buys vehicles, medicines, rice and chemicals; NRCS approval for regulated goods.From India 2025-26US$ 7.01 bn
More in leather & footwear
All products → Free, with conditionsLeather & footwearLeather goods (bags, wallets, belts)Leather handbags, wallets and travel goods for brands; the USA and Europe buy most.HS4202Exports 2025-26US$ 1.59 bn ↓1.8%
 Free, with conditionsLeather & footwearFinished leatherFinished hides and skins for shoe, bag and glove factories abroad; Vietnam, Italy and China buy most.HS4107Exports 2025-26US$ 314 mn ↓13.7%
 Free, with conditionsLeather & footwearLeather garments and glovesLeather jackets, work gloves and fashion gloves; the USA, Spain, Germany and Italy are the top buyers.HS4203Exports 2025-26US$ 783 mn ↑4.2%
 Free to exportLeather & footwearNon-leather footwearSports shoes, canvas shoes, sandals and slippers; the USA, the UAE, the Netherlands and Germany lead.HS6402Exports 2025-26US$ 483 mn ↑8.9%