

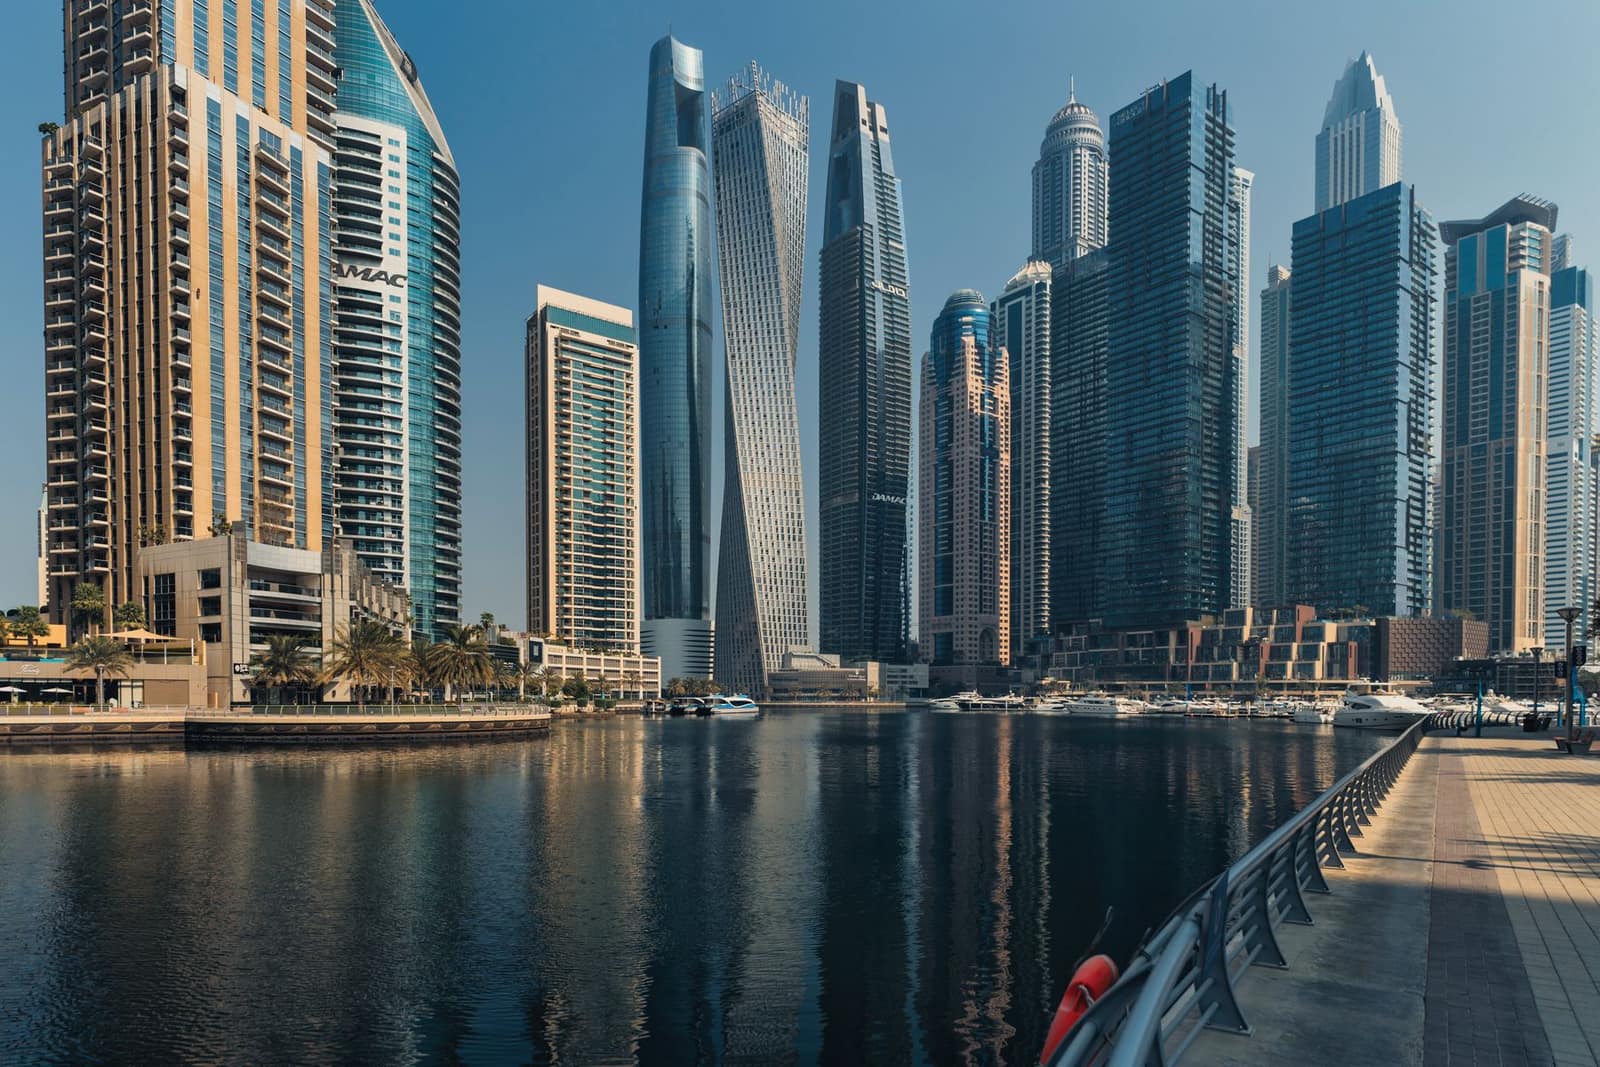
Gulf & Middle East
Export to United Arab Emirates
India's biggest Gulf buyer and a re-export hub for the Middle East and Africa. CEPA in force since 2022.
- Capital
- Abu Dhabi
- Currency
- AED
- Trade agreement with India
- India–UAE Comprehensive Economic Partnership Agreement (CEPA) 1 May 2022
- Main ports
- Jebel Ali (Dubai), Khalifa Port (Abu Dhabi), Khalid Port (Sharjah)
The UAE is close, ships arrive from Mundra or Nhava Sheva in a few days, and a large Indian trading community already runs import businesses there. Much of what lands at Jebel Ali is re-exported to Africa, Iran, Iraq and Central Asia. This makes it the most common first market for new Indian exporters.
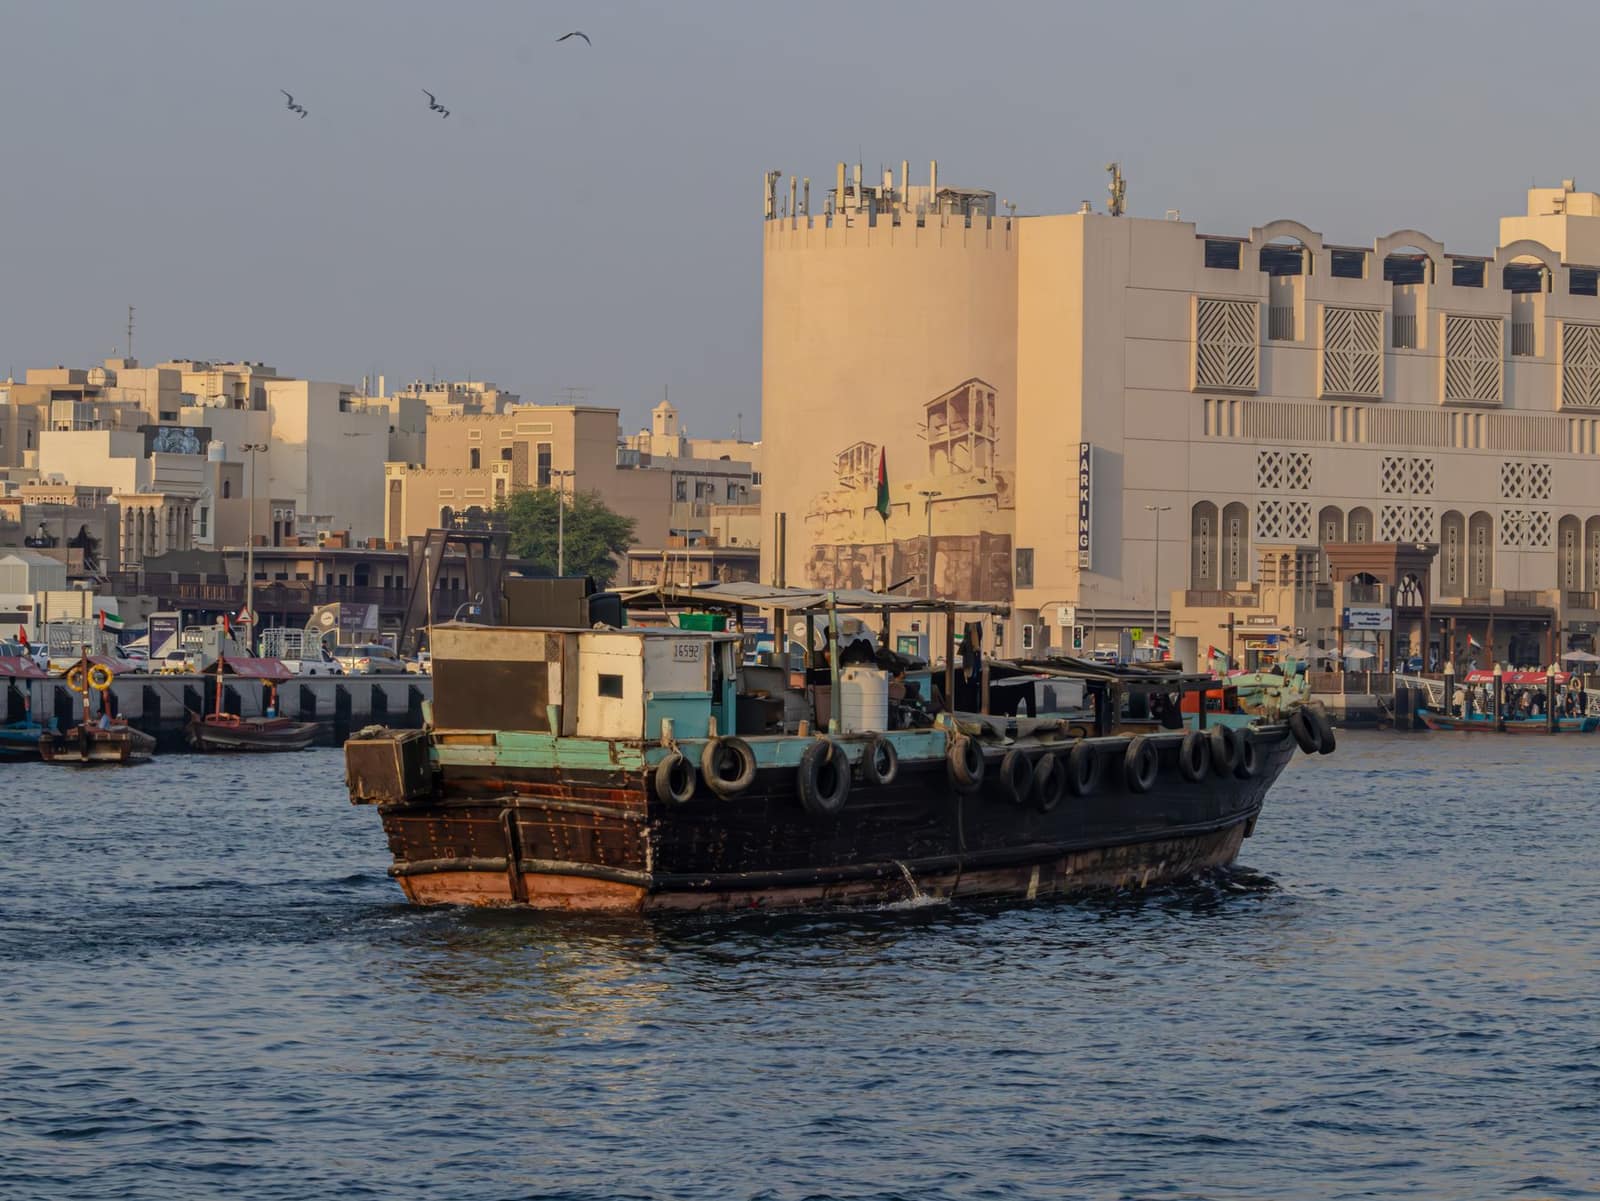
The UAE gives preferential (mostly zero) duty on about 97% of its tariff lines for Indian goods. To claim it, get a CEPA certificate of origin from DGFT's online platform and make sure your product meets the rules of origin.
What it buys from India
- Electrical machinery and equipment, including smartphones
- Boilers, generators, machinery and organic and inorganic chemicals
- Petroleum products, gems and jewellery
- Rice, spices, fresh fruit and vegetables, meat and processed food
Import rules on their side
- Food labels must carry Arabic (Arabic plus English is usual) and follow GCC labelling standards, including production and expiry dates.
- Food is imported by a UAE-registered importer, and the products are registered with the emirate's food authority (for example Dubai Municipality) before the first shipment.
- Meat and meat products need a halal certificate from a body the UAE accepts.
- Regulated non-food goods (for example electrical items, toys, some building products) need conformity certification under MoIAT schemes.
Practical tips
- Many UAE buyers want credit terms. For a first order ask for an advance or an LC, and take ECGC cover if you give credit.
- Gulfood in Dubai is the main food trade fair for the region; India usually has a large national pavilion organised by APEDA.
- If the buyer re-exports, ask which country the goods finally go to — labels and certificates may need to meet that country's rules too.
Sources (8)
- PIB — India-UAE CEPA enters into force (1 May 2022)
- PIB backgrounder — India's Trade Partnerships (27 Feb 2026)
- Department of Commerce — TradeStat export-import data bank
- UAE Ministry of Industry and Advanced Technology (MoIAT)
- Dubai Municipality — food safety and import
- Dubai Customs
- GCC Standardization Organization (GSO)
- Gulfood (Dubai World Trade Centre)
Trade data
India’s exports to United Arab Emirates in numbers
From the Department of Commerce’s TradeStat (Indian financial years, April–March), the country’s imports from the world from UN Comtrade, and its basics from the World Bank.
- India’s exports here, 2025-26
- US$ 37.4 bn No. 2 of our 30 countries
- Change from 2024-25
- ↑ +2% US$ 36.6 bn → US$ 37.4 bn
- Share of all Indian exports
- 8.46%
- Its imports from the world
- US$ 470.5 bn 2023 · India’s share 7.79%
What India sells here most
By HS chapter, 2025-26. Change is against 2024-25.
What is rising and what is falling
Chapters where India sells at least US$ 5 million. Change from 2024-25 to 2025-26.
↑ High demand
- Dairy, eggs, honeyUS$ 118 mn → US$ 214 mn↑+82.2%
- MeatUS$ 367 mn → US$ 517 mn↑+40.8%
- Electrical and electronicsUS$ 3.84 bn → US$ 5.4 bn↑+40.6%
- Cereals (rice, wheat, maize)US$ 524 mn → US$ 723 mn↑+38%
- MachineryUS$ 1.79 bn → US$ 2.35 bn↑+31.6%
- VegetablesUS$ 230 mn → US$ 289 mn↑+25.4%
- Ships and boatsUS$ 1.11 bn → US$ 1.31 bn↑+18.7%
- Vehicles and partsUS$ 1.01 bn → US$ 1.18 bn↑+17.1%
↓ Low demand
- Inorganic chemicalsUS$ 290 mn → US$ 222 mn↓-23.6%
- Fuels and petroleum productsUS$ 7.6 bn → US$ 5.85 bn↓-23%
- Iron and steelUS$ 704 mn → US$ 616 mn↓-12.5%
- Paper and paperboardUS$ 372 mn → US$ 334 mn↓-10.3%
Opportunity: what this country buys from the world, and from India
The country’s own recorded imports in UN Comtrade, 2023. Chapters with the biggest gap between what it buys from the world and what it buys from India.
Our product guides that sell here
India’s exports of each product to this country, 2025-26.
The 20 biggest export lines
4-digit HS lines, 2025-26, with their Harmonized System descriptions.
What India buys from United Arab Emirates
India’s imports from this country in 2025-26 by HS chapter, from TradeStat — this country can be your supplier too.
- India’s imports, 2025-26
- US$ 63.9 bn US$ 63.4 bn → US$ 63.9 bn
- India’s exports, 2025-26
- US$ 37.4 bn
- Trade balance
- −US$ 26.5 bn exports minus imports
- Change in imports
- +0.8%
The country at a glance
- Population
- 11.5 mn 2025
- GDP
- US$ 552.3 bn 2024
- GDP per person
- US$ 50,274 2024
- Imports (goods and services)
- US$ 481.9 bn 2023
Sources: TradeStat — Export Import Data Bank, Department of Commerce · UN Comtrade database (United Nations Statistics Division) · World Bank — World Development Indicators · Figures taken 29 October 2026.
What to send to United Arab Emirates
All products → Free, with conditionsFarm produceBasmati riceIndia’s top agri export by value. Free to export, but every contract must be registered with APEDA first.HS1006.30Exports 2025-26US$ 5.67 bn ↓4.6%
 Free, with conditionsFarm produceNon-basmati riceHigh-volume staple sold mainly to Africa and Bangladesh. Export reopened in 2024–25, but contracts must now be registered with APEDA.HS1006.30Exports 2025-26US$ 5.86 bn ↓10.2%
 Free to exportFarm produceSpicesWhole, ground and blended spices. Spices Board registration (CRES) is compulsory; residue and ethylene oxide tests keep buyers.HS0904–0910Exports 2025-26US$ 3.12 bn ↓5.1%
 Free to exportFarm produceFresh onionBig-volume fresh export to Asia and the Gulf. Policy swings with domestic prices — check DGFT and CBIC before every season.HS0703.10Exports 2025-26US$ 430 mn ↓8.3%
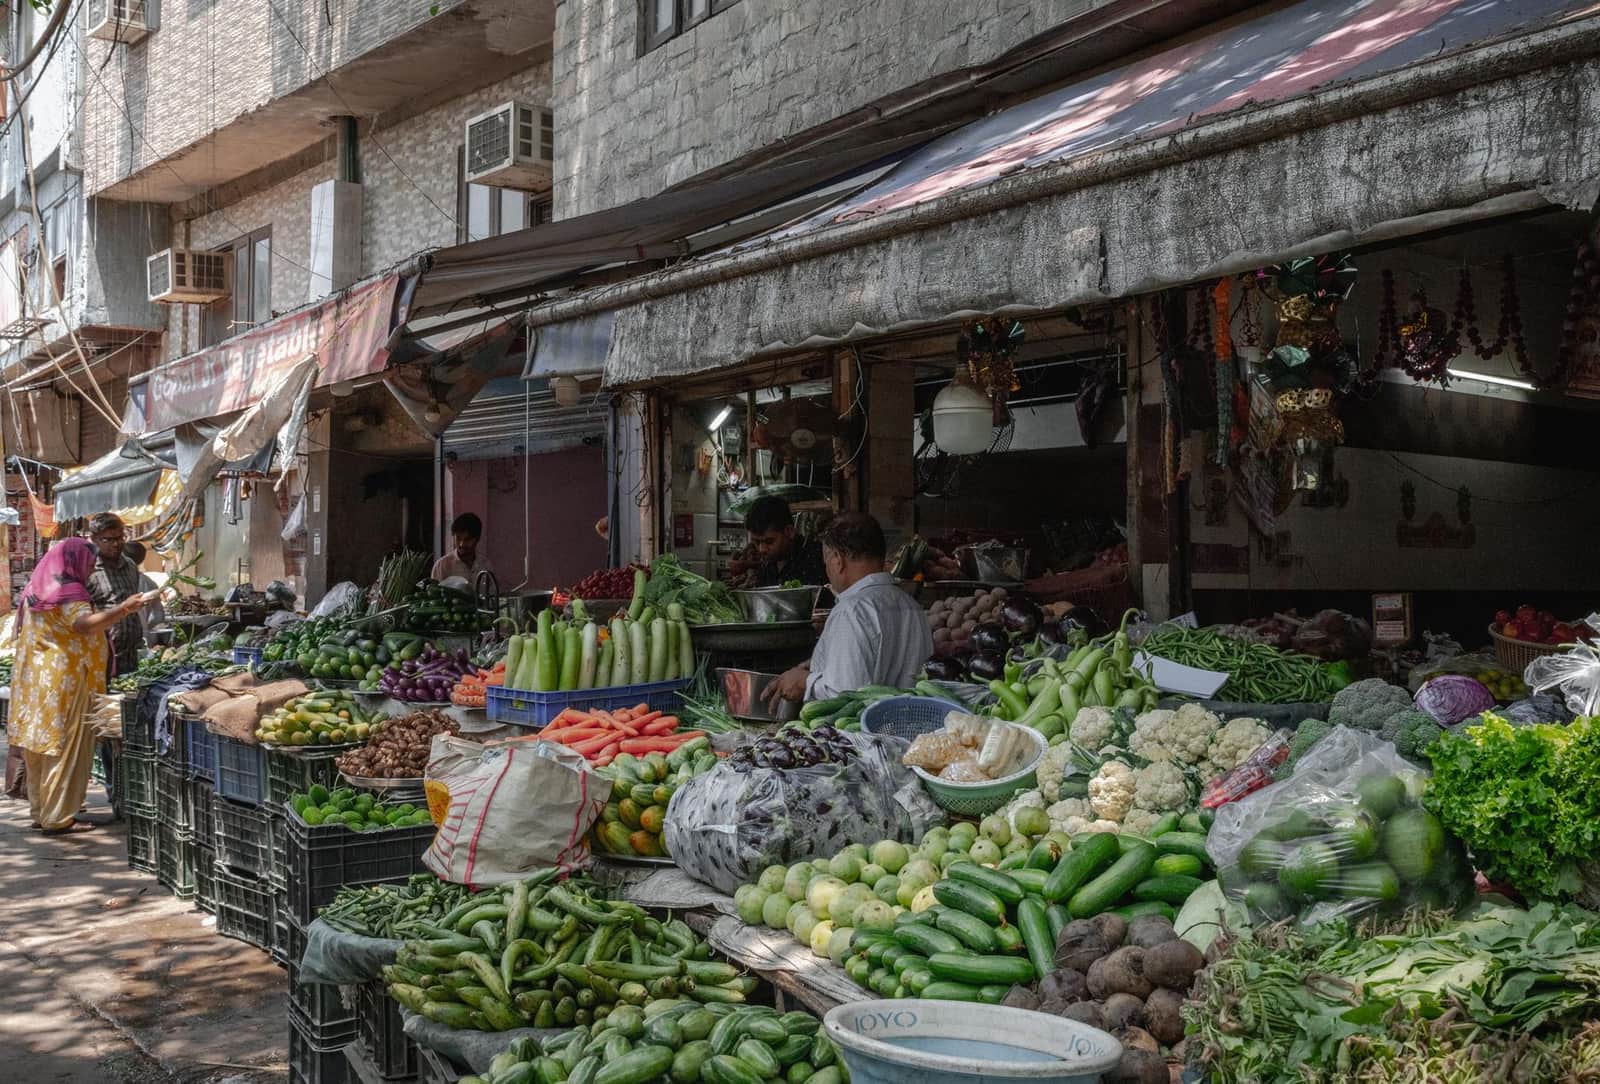 Free to exportFarm produceFresh vegetablesOkra, green chilli, drumstick, gourds and potatoes for Gulf and UK ethnic markets. Fast, perishable and residue-sensitive.HS07Exports 2025-26US$ 2.26 bn ↑3%
 Free to exportFarm produceFresh mangoAlphonso, Kesar, Banganapalli and more, for a short summer season. Each market has its own treatment: irradiation, hot water or vapour heat.HS0804.50Exports 2025-26US$ 148 mn ↓4.6%
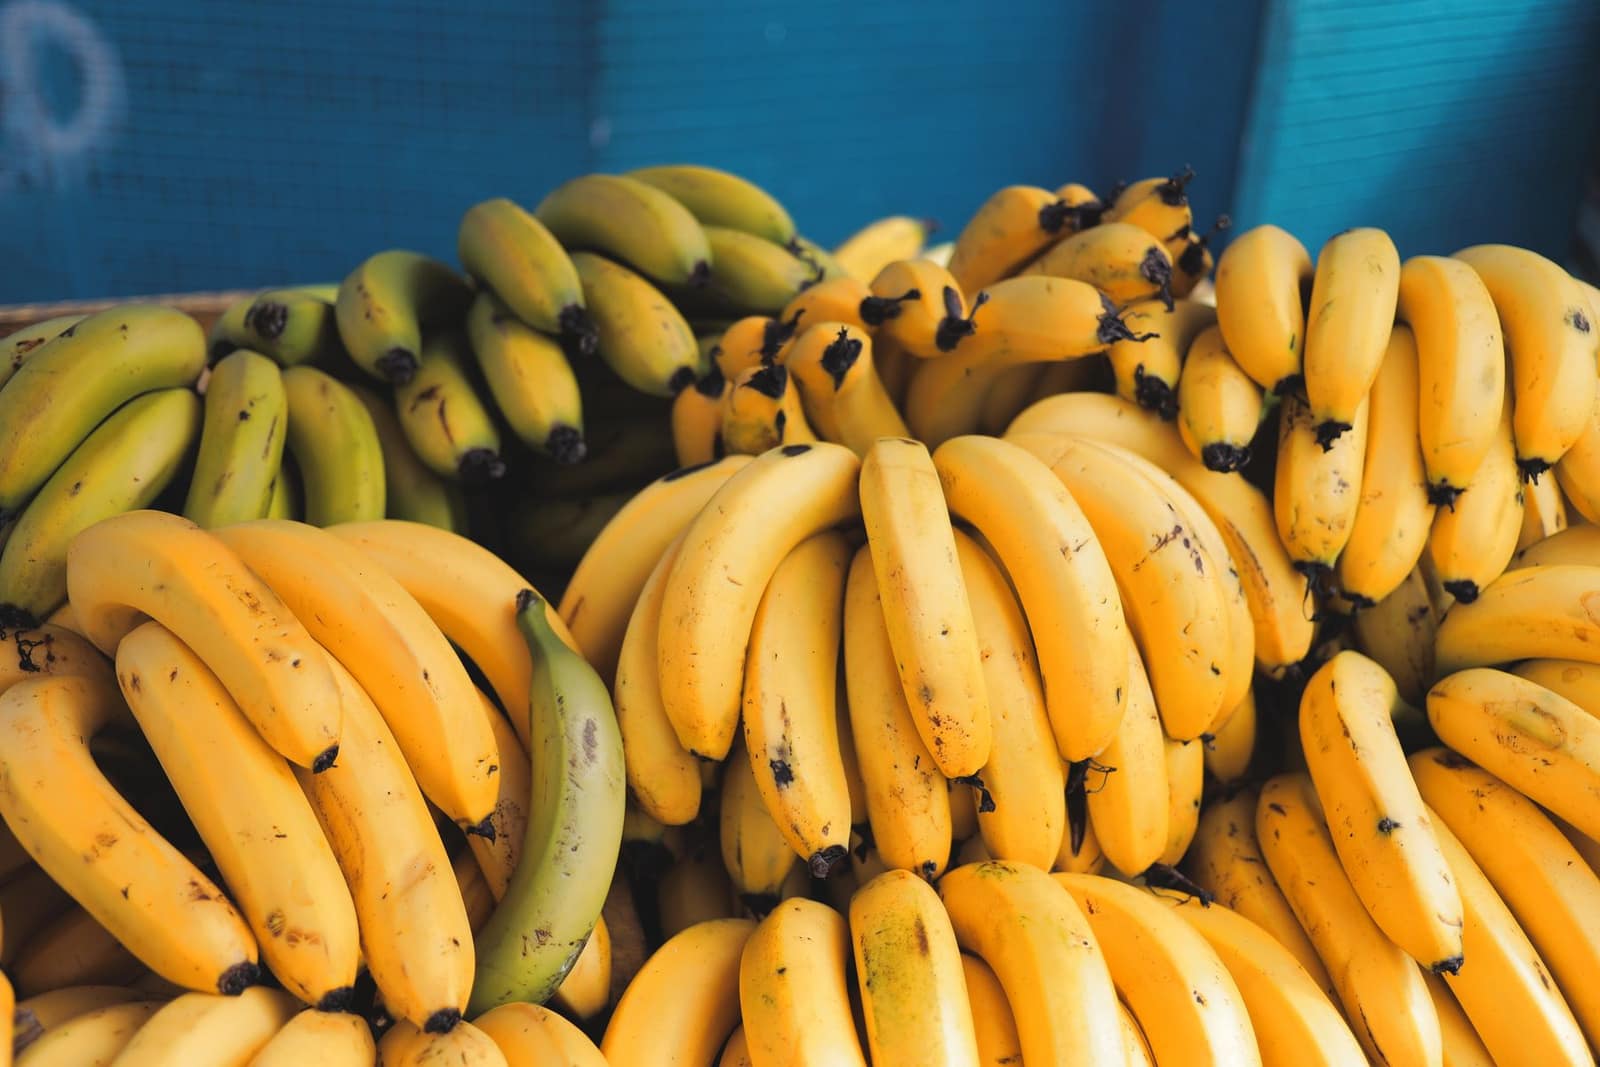 Free to exportFarm produceFresh bananaCavendish bananas by reefer to the Gulf and Central Asia. Harvest maturity, cold chain and ripening control decide profit.HS0803.90Exports 2025-26US$ 496 mn ↑30.5%
 Free to exportProcessed foodTeaAssam, Darjeeling, Nilgiri and CTC tea. You need a Tea Board exporter licence; residues and GI rules matter.HS0902Exports 2025-26US$ 899 mn ↑8%
More in Gulf & Middle East
 SARRiyadhSaudi ArabiaLarge Gulf market for rice, food and engineering goods. Strict SFDA food rules and SABER certification for regulated goods.From India 2025-26US$ 10.3 bn
 CEPAOMRMuscatOmanNew CEPA in force since June 2026 — almost all Indian goods now enter duty-free. Short sea route from Gujarat.From India 2025-26US$ 4.02 bn
 QARDohaQatarSmall, wealthy Gulf market with a huge Indian workforce. Imports nearly all its food.From India 2025-26US$ 1.62 bn
 KWDKuwait CityKuwaitRich Gulf market with a large Indian community. Buys rice, food, garments and engineering goods.From India 2025-26US$ 1.65 bn