


Americas
Export to United States of America
India's largest single-country export market. Strict FDA rules for food; extra 10% US duty on most goods since July 2026.
- Capital
- Washington, D.C.
- Currency
- USD
- Trade agreement with India
- India–US Bilateral Trade Agreement (under negotiation; interim framework announced Feb 2026) Not in force yetNot in force
- Main ports
- New York / New Jersey, Savannah, Houston
The US buys the widest range of Indian goods: medicines, gems, garments, home textiles, engineering goods, shrimp and spices. Buyers pay well but expect paperwork and quality to be right first time. Food exporters must register with the US FDA before shipping, and US tariffs on Indian goods have changed several times since 2025, so check the rate for your product every time you quote.
There is no trade agreement in force. Tariff position last confirmed (Oct 2026): since 24 July 2026 the US charges an additional 10% duty on most Indian goods under Section 301 (USTR final action of 23 July 2026), on top of the normal US duty for the product. The Commerce Ministry says about 45% of India's exports to the US are outside this 10% duty, and goods under Section 232 (such as steel, aluminium and auto parts) carry those duties instead. Always check your HTS code and confirm the current rate on the USTR and CBP websites before quoting a price.
What it buys from India
- Generic medicines and pharmaceutical ingredients
- Cut and polished diamonds, gems and jewellery
- Garments, home textiles and carpets
- Engineering goods, auto parts and electronics, including smartphones
- Frozen shrimp, spices, basmati rice and cashew
Import rules on their side
- Every food factory or warehouse that makes, packs or stores food for the US must register with the FDA and name a US agent. Registration must be renewed between October and December of every even-numbered year — 2026 is a renewal year.
- Prior Notice must be filed with the FDA for every food shipment before it arrives. The US importer must also check you as a supplier under the Foreign Supplier Verification Programme (FSVP).
- Canned low-acid or acidified foods need an extra FDA process filing. Labels must follow FDA rules, including the Nutrition Facts panel and allergen declaration.
- Children's products and toys need testing and a Children's Product Certificate; textile goods need fibre content and country-of-origin labels.
Practical tips
- Write the tariff into the contract: agree in writing who pays the extra US duty, and use Incoterms such as FOB or CIF rather than DDP until you know your landed cost.
- Shrimp, spices and rice shipments are often detained for residues or contamination. Test every lot at a laboratory before shipping.
- US buyers usually pay by wire transfer on open account or documents against payment. Check the buyer's credit and take ECGC cover on credit sales.
Sources (9)
- PIB — Final US Section 301 measures on forced labour: India placed in lower tariff tier at 10%
- USTR — Fact sheet: Section 301 action on 60 economies (July 2026)
- US Federal Register — Notice of actions in Section 301 investigations (28 Jul 2026)
- Department of Commerce — United States-India Joint Statement (7 Feb 2026)
- US International Trade Commission — Harmonized Tariff Schedule search
- US Customs and Border Protection — Trade
- US FDA — Registration of food facilities and other submissions
- US FDA — Prior notice of imported foods
- Department of Commerce — TradeStat export-import data bank
Trade data
India’s exports to United States of America in numbers
From the Department of Commerce’s TradeStat (Indian financial years, April–March), the country’s imports from the world from UN Comtrade, and its basics from the World Bank.
- India’s exports here, 2025-26
- US$ 87.3 bn No. 1 of our 30 countries
- Change from 2024-25
- ↑ +0.9% US$ 86.5 bn → US$ 87.3 bn
- Share of all Indian exports
- 19.78%
- Its imports from the world
- US$ 3,356.8 bn 2024 · India’s share 2.79%
What India sells here most
By HS chapter, 2025-26. Change is against 2024-25.
What is rising and what is falling
Chapters where India sells at least US$ 5 million. Change from 2024-25 to 2025-26.
↑ High demand
- Electrical and electronicsUS$ 15.9 bn → US$ 25.7 bn↑+61.5%
- Instruments, medical devicesUS$ 949 mn → US$ 1.27 bn↑+34.2%
- AluminiumUS$ 860 mn → US$ 1.09 bn↑+27.2%
- Iron and steelUS$ 588 mn → US$ 741 mn↑+26.1%
- AircraftUS$ 457 mn → US$ 516 mn↑+13.1%
↓ Low demand
- Gems, jewellery, precious metalsUS$ 9.97 bn → US$ 5.12 bn↓-48.7%
- Stone, plaster, cement articlesUS$ 953 mn → US$ 679 mn↓-28.8%
- PlasticsUS$ 1.67 bn → US$ 1.37 bn↓-18.3%
- Fish and seafoodUS$ 2.04 bn → US$ 1.69 bn↓-17.4%
- Fuels and petroleum productsUS$ 4.21 bn → US$ 3.52 bn↓-16.3%
- Medicines and pharmaUS$ 9.78 bn → US$ 8.67 bn↓-11.4%
- Knitted garmentsUS$ 2.66 bn → US$ 2.36 bn↓-11.2%
- Home textiles, made-upsUS$ 2.95 bn → US$ 2.63 bn↓-10.8%
Opportunity: what this country buys from the world, and from India
The country’s own recorded imports in UN Comtrade, 2024. Chapters with the biggest gap between what it buys from the world and what it buys from India.
Our product guides that sell here
India’s exports of each product to this country, 2025-26.
The 20 biggest export lines
4-digit HS lines, 2025-26, with their Harmonized System descriptions.
What India buys from United States of America
India’s imports from this country in 2025-26 by HS chapter, from TradeStat — this country can be your supplier too.
- India’s imports, 2025-26
- US$ 53.5 bn US$ 45.6 bn → US$ 53.5 bn
- India’s exports, 2025-26
- US$ 87.3 bn
- Trade balance
- +US$ 33.9 bn exports minus imports
- Change in imports
- +17.2%
The country at a glance
- Population
- 342 mn 2025
- GDP
- US$ 30,769.7 bn 2025
- GDP per person
- US$ 90,027 2025
- Imports (goods and services)
- US$ 4,113.8 bn 2024
Sources: TradeStat — Export Import Data Bank, Department of Commerce · UN Comtrade database (United Nations Statistics Division) · World Bank — World Development Indicators · Figures taken 29 October 2026.
What to send to United States of America
All products → Free to exportMarineFrozen shrimpIndia’s top seafood export. Needs MPEDA registration and an EIC-approved plant; residue testing and US trade measures shape the business.HS0306.17Exports 2025-26US$ 5.61 bn ↑9.1%
 Free to exportFarm produceSpicesWhole, ground and blended spices. Spices Board registration (CRES) is compulsory; residue and ethylene oxide tests keep buyers.HS0904–0910Exports 2025-26US$ 3.12 bn ↓5.1%
 Free, with conditionsFarm produceBasmati riceIndia’s top agri export by value. Free to export, but every contract must be registered with APEDA first.HS1006.30Exports 2025-26US$ 5.67 bn ↓4.6%
 Free to exportProcessed foodCashew kernelsGraded kernels (W180–W450, splits, pieces) and roasted cashew. CEPCI is the council; Vietnam and the UAE are top buyers.HS0801.32Exports 2025-26US$ 379 mn ↑11.9%
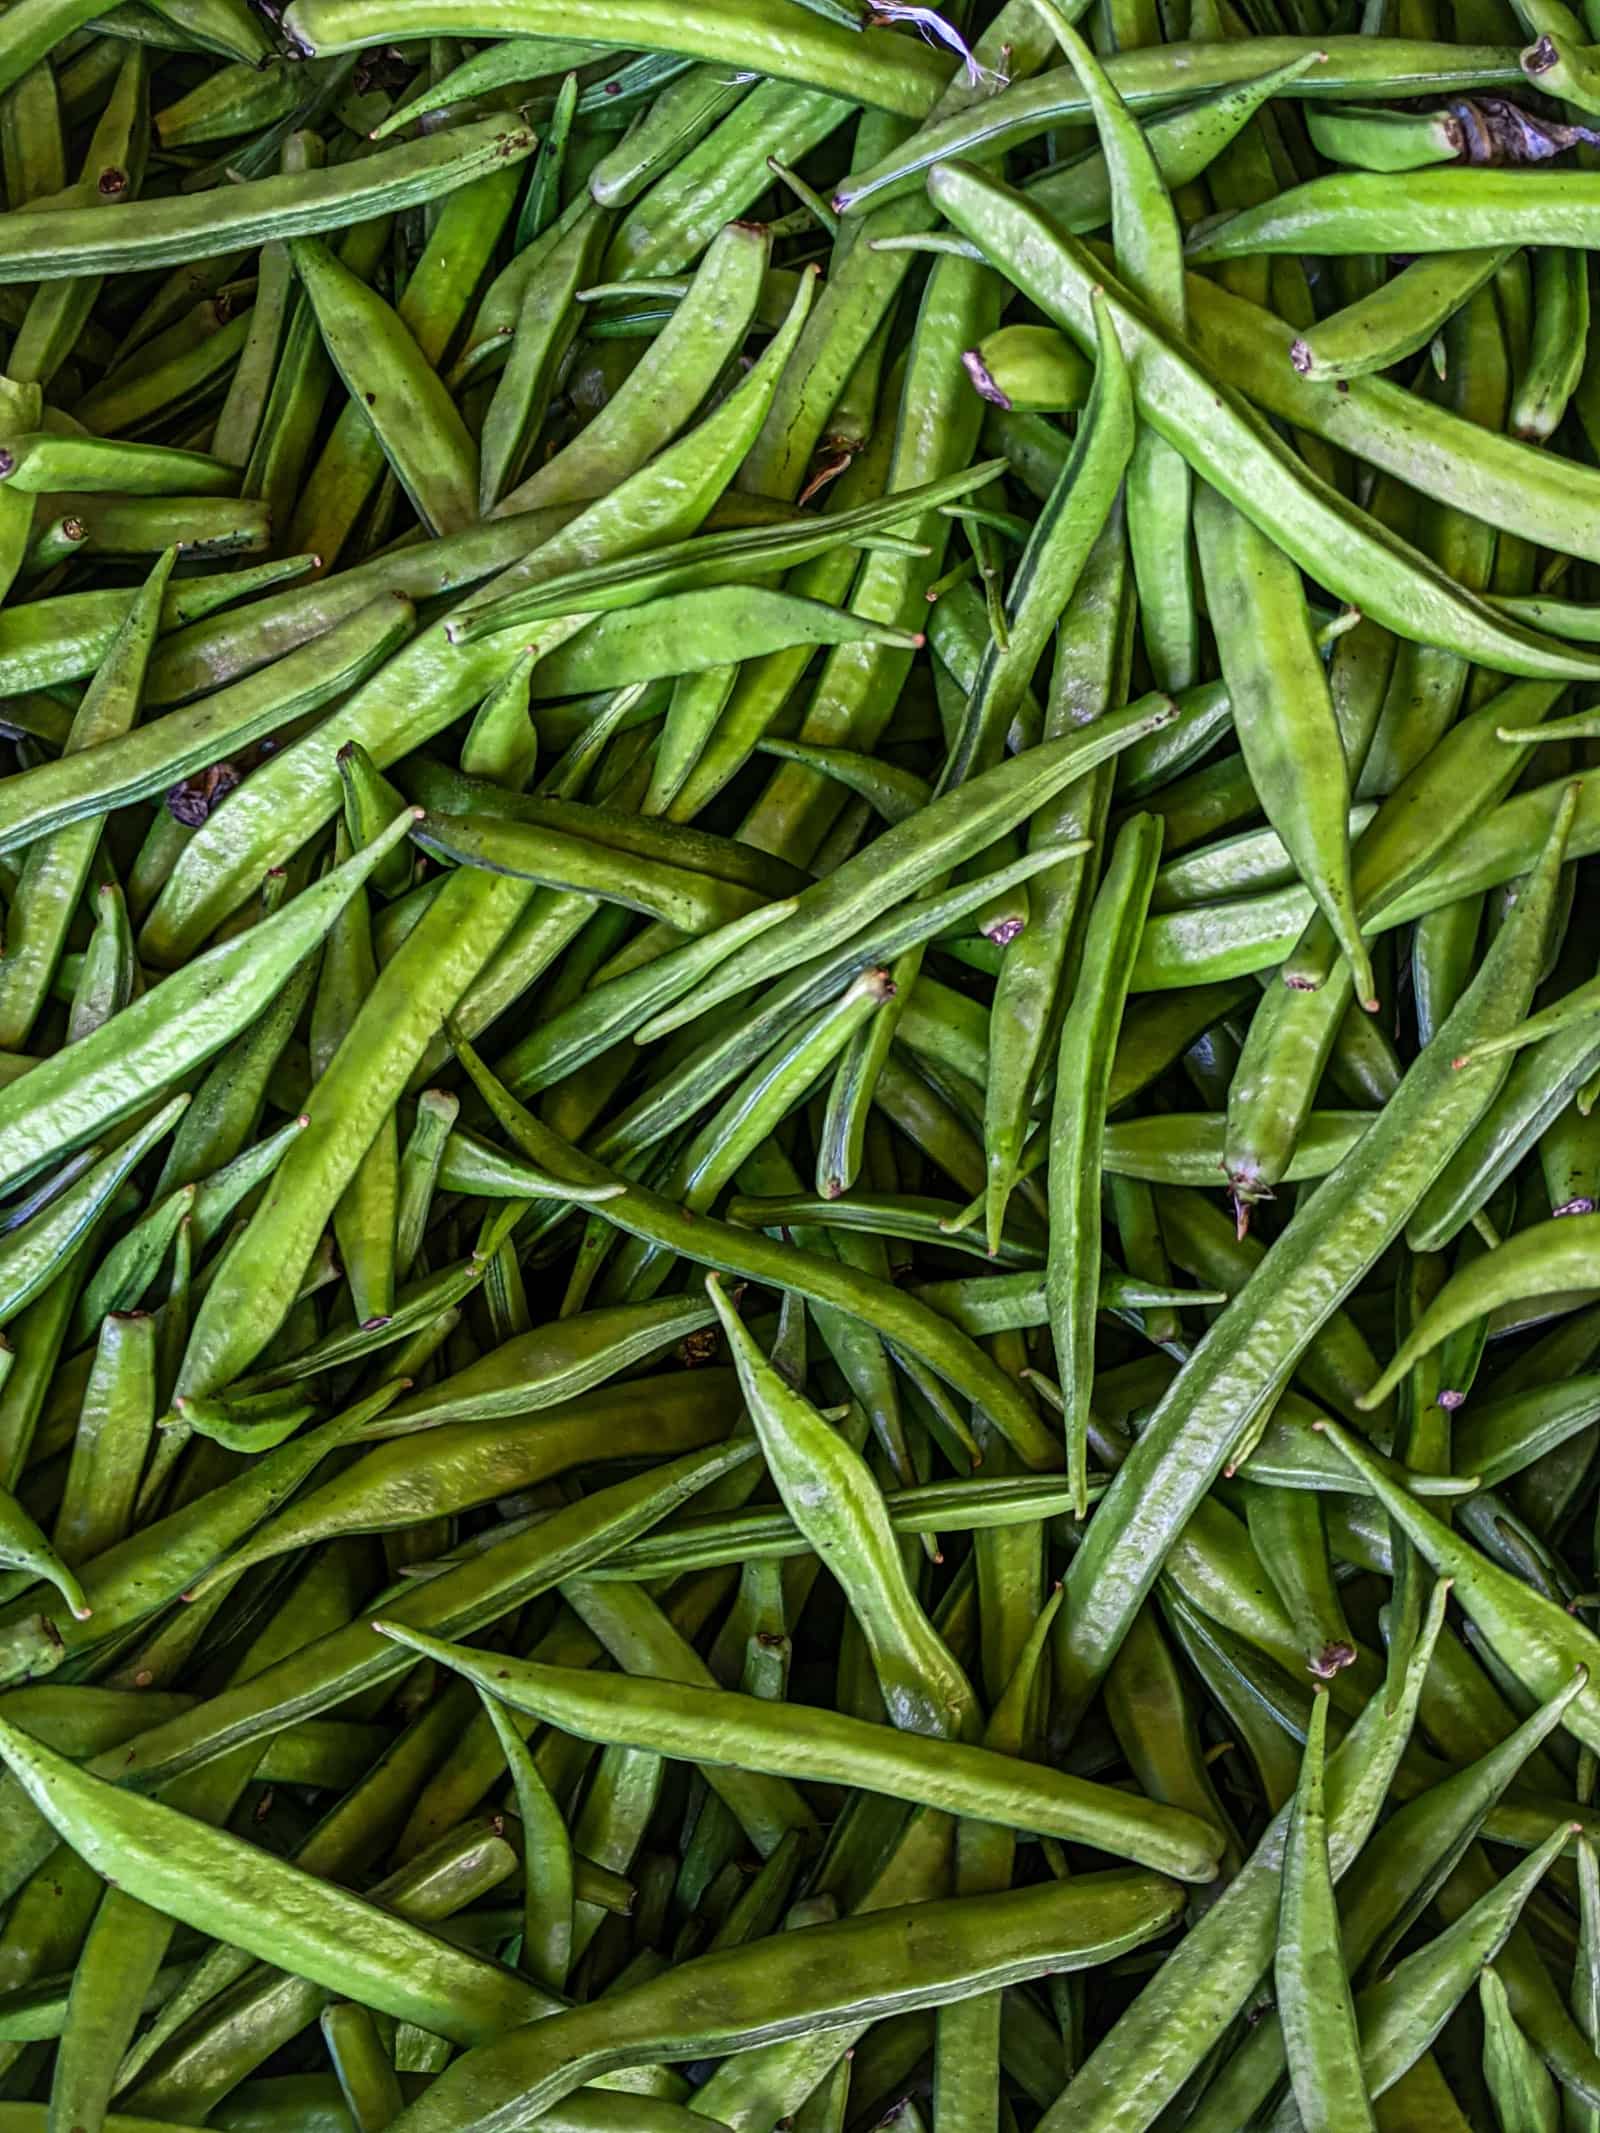 Free to exportFarm produceGuar gumRajasthan’s guar processed into gum for oil drilling, food and textiles. Industrial buyers set strict viscosity specs.HS1302.32Exports 2025-26US$ 393 mn ↓7.1%
 Free, with conditionsFarm produceOrganic productsCertified organic grains, oilseeds, spices, tea and processed foods. Only NPOP certification lets you export as "organic".HSVaries
 Free to exportTextiles & apparelReadymade garmentsKnitted and woven clothing for brands and retailers; the USA, UK, UAE and the EU are the big buyers.HS6109.10Exports 2025-26US$ 15.8 bn ↓1.2%
 Free to exportTextiles & apparelHome textiles (bed, bath and kitchen linen)Bedsheets, towels and kitchen linen for retailers; the USA buys more than half of India's exports.HS6302Exports 2025-26US$ 2.01 bn ↓5.7%