


Europe
Export to Italy
Manufacturing buyer of Indian leather, yarn, castings, chemicals and seafood. EU rules apply.
- Capital
- Rome
- Currency
- EUR
- Trade agreement with India
- India–EU Free Trade Agreement (concluded, not yet in force) Not in force yetNot yet in force (talks concluded 27 Jan 2026)
- Main ports
- Genoa, La Spezia, Gioia Tauro
Italy's factories make fashion, leather goods, machinery and food for the world, and they buy Indian inputs: finished leather, cotton yarn, castings and forgings, auto parts, organic chemicals and marine products. Many buyers are small family firms that value long relationships and consistent quality.

Italy trades with India under EU rules. The India–EU FTA was concluded on 27 January 2026 and was expected to be signed by December 2026, with entry into force around early 2027 (Commerce Minister, June 2026). Normal EU duties apply until then. Confirm current status on commerce.gov.in.
What it buys from India
- Organic chemicals and petroleum products
- Leather, cotton yarn, garments and footwear
- Iron and steel, castings, machinery and auto parts
- Marine products and spices
Import rules on their side
- All EU rules apply — MRLs, REACH, CE marking, CBAM data for steel and aluminium goods, and EUDR checks on leather (cattle), wood and rubber from 30 December 2026 for large and medium importers.
- Consumer labels must be in Italian.
- Leather and textiles are tested for restricted chemicals such as chromium VI and azo dyes.
Practical tips
- Lineapelle (leather, Milan) and Pitti Filati (yarn, Florence) are useful fairs for input suppliers.
- Italian buyers expect samples to match bulk exactly; keep a reference sample from every lot.
- Payment terms of 60–90 days are common; protect yourself with ECGC cover or factoring.
Sources (8)
- Department of Commerce — India-EU Free Trade Agreement concluded (27 Jan 2026)
- All India Radio News — India-EU likely to sign FTA by December: Piyush Goyal (21 Jun 2026)
- European Commission — Access2Markets (EU tariffs and import rules by product)
- European Commission — Regulation on deforestation-free products (EUDR)
- European Commission — Carbon Border Adjustment Mechanism (CBAM)
- European Chemicals Agency — Understanding REACH
- Customs and Monopolies Agency, Italy (ADM)
- Department of Commerce — TradeStat export-import data bank
Trade data
India’s exports to Italy in numbers
From the Department of Commerce’s TradeStat (Indian financial years, April–March), the country’s imports from the world from UN Comtrade, and its basics from the World Bank.
- India’s exports here, 2025-26
- US$ 7.79 bn No. 10 of our 30 countries
- Change from 2024-25
- ↑ +0.8% US$ 7.73 bn → US$ 7.79 bn
- Share of all Indian exports
- 1.76%
- Its imports from the world
- US$ 621.6 bn 2024 · India’s share 1.6%
What India sells here most
By HS chapter, 2025-26. Change is against 2024-25.
What is rising and what is falling
Chapters where India sells at least US$ 5 million. Change from 2024-25 to 2025-26.
↑ High demand
- Fuels and petroleum productsUS$ 7.8 mn → US$ 219 mn↑+2,726.7%
- Cereals (rice, wheat, maize)US$ 42.7 mn → US$ 70.8 mn↑+66.1%
- Medicines and pharmaUS$ 65.1 mn → US$ 92.7 mn↑+42.4%
- Inorganic chemicalsUS$ 62.4 mn → US$ 82.5 mn↑+32.2%
- Vehicles and partsUS$ 324 mn → US$ 414 mn↑+27.8%
- RubberUS$ 144 mn → US$ 183 mn↑+27.6%
- MachineryUS$ 624 mn → US$ 752 mn↑+20.5%
- Fish and seafoodUS$ 173 mn → US$ 204 mn↑+18%
↓ Low demand
- Electrical and electronicsUS$ 1.61 bn → US$ 822 mn↓-48.9%
- CottonUS$ 87.4 mn → US$ 70.2 mn↓-19.7%
- Salt, stone, cementUS$ 46.6 mn → US$ 39.9 mn↓-14.4%
- Other chemical productsUS$ 84.5 mn → US$ 75.8 mn↓-10.3%
- FootwearUS$ 120 mn → US$ 108 mn↓-10.2%
Opportunity: what this country buys from the world, and from India
The country’s own recorded imports in UN Comtrade, 2024. Chapters with the biggest gap between what it buys from the world and what it buys from India.
Our product guides that sell here
India’s exports of each product to this country, 2025-26.
The 20 biggest export lines
4-digit HS lines, 2025-26, with their Harmonized System descriptions.
What India buys from Italy
India’s imports from this country in 2025-26 by HS chapter, from TradeStat — this country can be your supplier too.
- India’s imports, 2025-26
- US$ 6.63 bn US$ 6.01 bn → US$ 6.63 bn
- India’s exports, 2025-26
- US$ 7.79 bn
- Trade balance
- +US$ 1.16 bn exports minus imports
- Change in imports
- +10.2%
The country at a glance
- Population
- 58.9 mn 2025
- GDP
- US$ 2,551.6 bn 2025
- GDP per person
- US$ 43,309 2025
- Imports (goods and services)
- US$ 773 bn 2025
Sources: TradeStat — Export Import Data Bank, Department of Commerce · UN Comtrade database (United Nations Statistics Division) · World Bank — World Development Indicators · Figures taken 29 October 2026.
What to send to Italy
All products → Free, with conditionsLeather & footwearLeather goods (bags, wallets, belts)Leather handbags, wallets and travel goods for brands; the USA and Europe buy most.HS4202Exports 2025-26US$ 1.59 bn ↓1.8%
 Free to exportLeather & footwearFootwearLeather shoes, sandals and boots from Agra, Kanpur and Tamil Nadu; the USA, UK and Germany lead.HS6403Exports 2025-26US$ 1.69 bn ↓4.7%
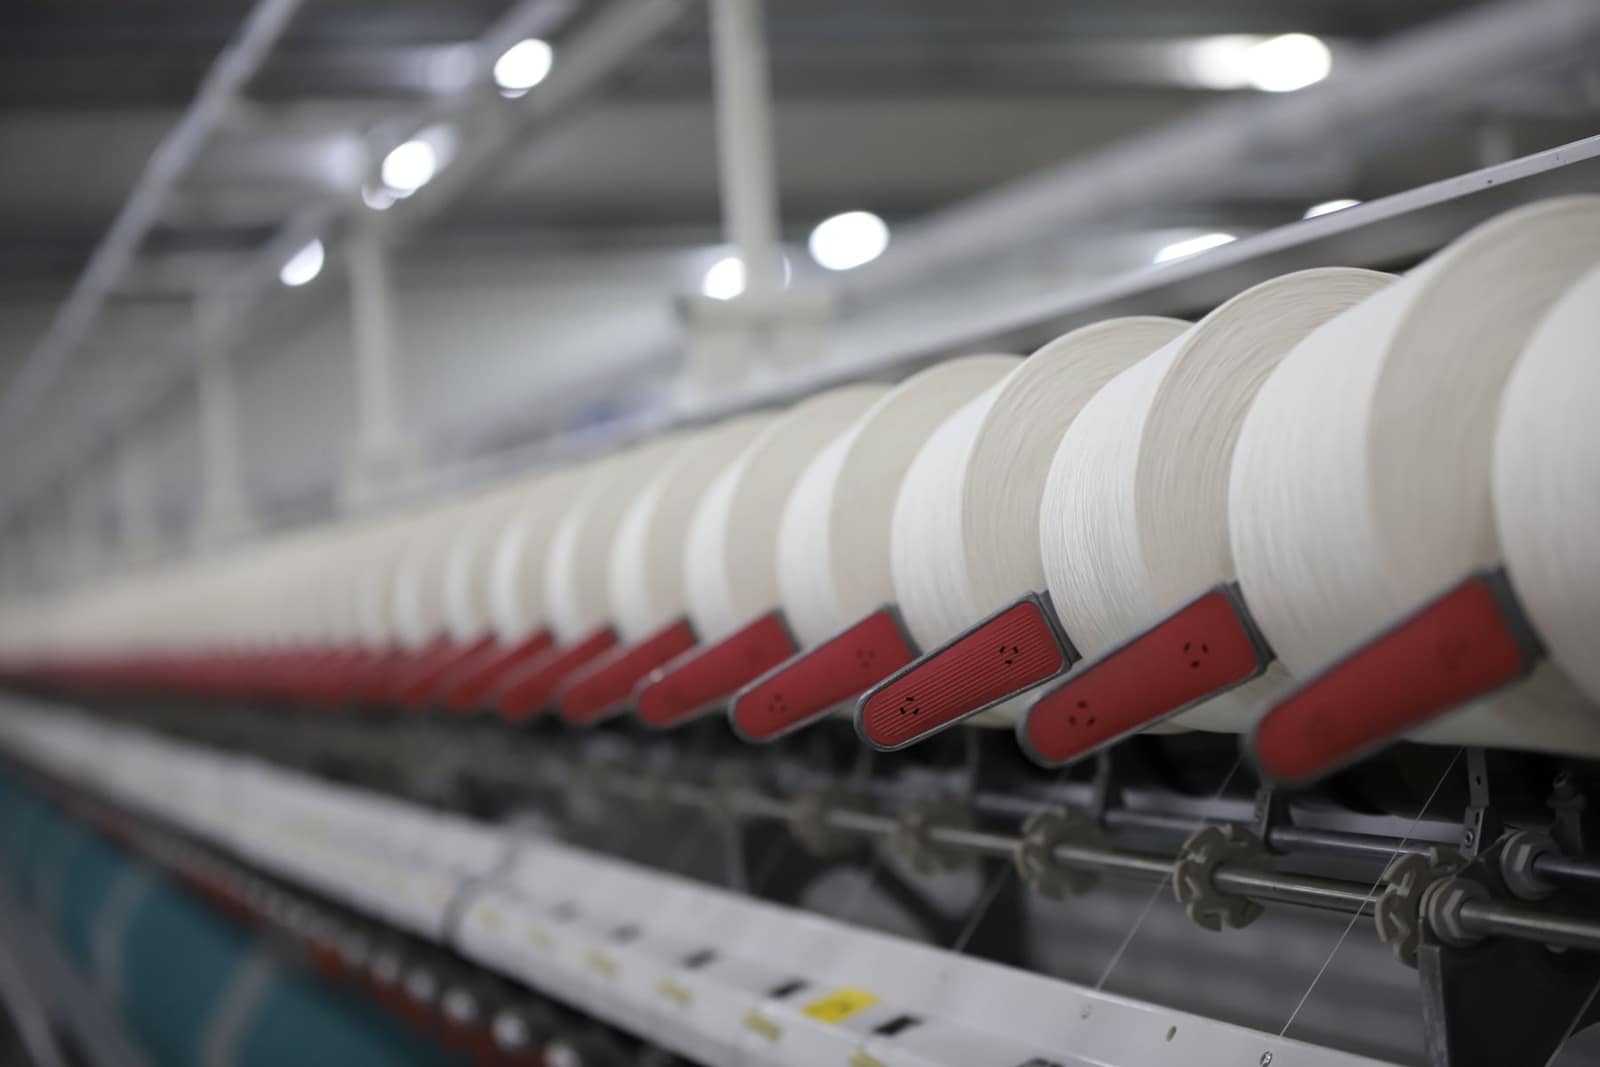 Free to exportTextiles & apparelCotton yarnBulk cotton yarn sold to weaving and knitting mills abroad; Bangladesh is by far the largest buyer.HS5205Exports 2025-26US$ 3.22 bn ↓4.1%
 Free to exportTextiles & apparelReadymade garmentsKnitted and woven clothing for brands and retailers; the USA, UK, UAE and the EU are the big buyers.HS6109.10Exports 2025-26US$ 15.8 bn ↓1.2%
 Free to exportEngineering goodsIron and steel castingsGrey and ductile iron and steel castings from Kolhapur, Rajkot, Coimbatore and Howrah; the USA leads.HS7325Exports 2025-26US$ 1.25 bn ↑3.2%
 Free to exportEngineering goodsAuto parts and componentsOEM and aftermarket vehicle parts; the USA, Germany and Italy buy most, with strong demand in Latin America.HS8708Exports 2025-26US$ 7.64 bn ↑1.8%
 Free to exportEngineering goodsHand toolsHammers, wrenches, pliers and garden tools from Jalandhar and Ludhiana; the USA buys most.HS8205Exports 2025-26US$ 161 mn ↓7%
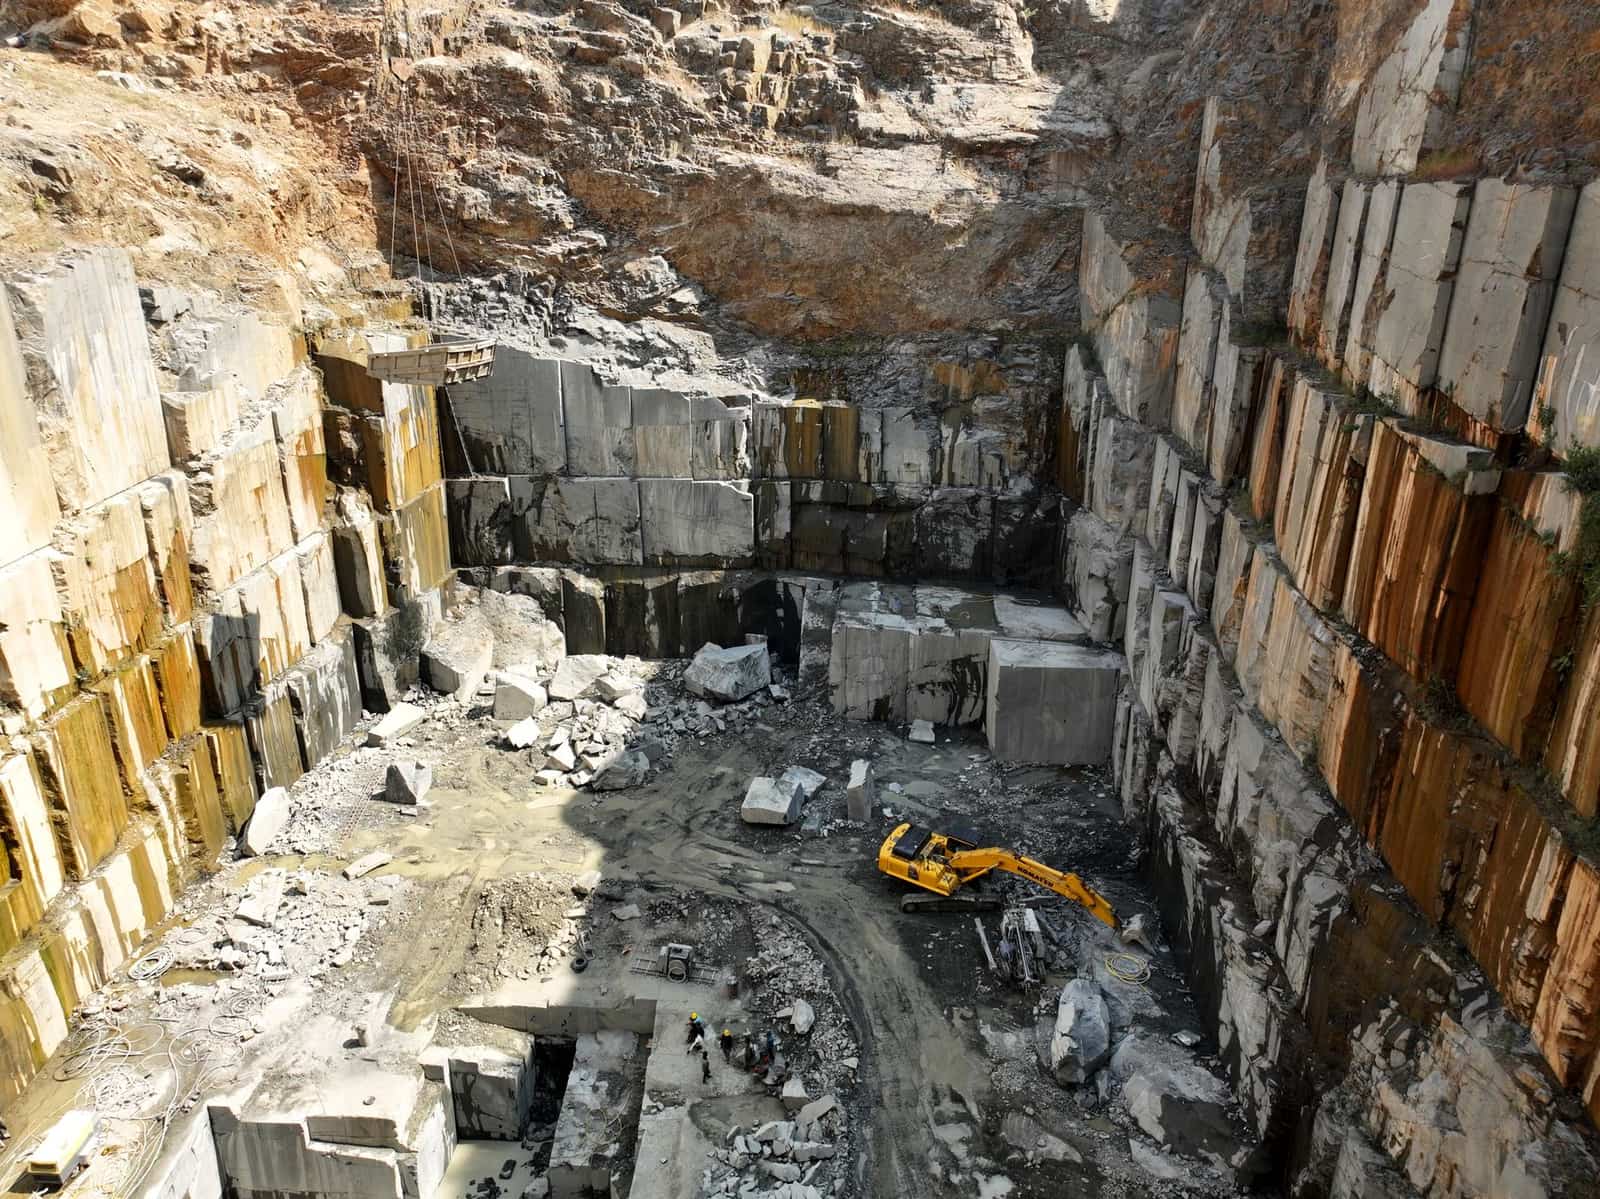 Free to exportOther goodsGranite and natural stonePolished granite slabs, monuments and sandstone from South India and Rajasthan; the USA leads.HS6802Exports 2025-26US$ 1.17 bn ↑0.7%
More in Europe
 CETAGBPLondonUnited KingdomNew CETA in force since July 2026 — most Indian goods now enter duty-free. Strong market for garments, food and engineering.From India 2025-26US$ 13.4 bn
 EURAmsterdamNetherlandsEurope's main gateway: Rotterdam handles goods for the whole EU. EU food-safety and residue rules apply.From India 2025-26US$ 17.5 bn
 EURBerlinGermanyEurope's largest economy and India's biggest EU partner. Values quality, certificates and supply-chain transparency.From India 2025-26US$ 11.5 bn
 EURParisFranceFashion, food and design market. EU rules plus French-language labels; SIAL Paris is a key food fair.From India 2025-26US$ 7.1 bn