

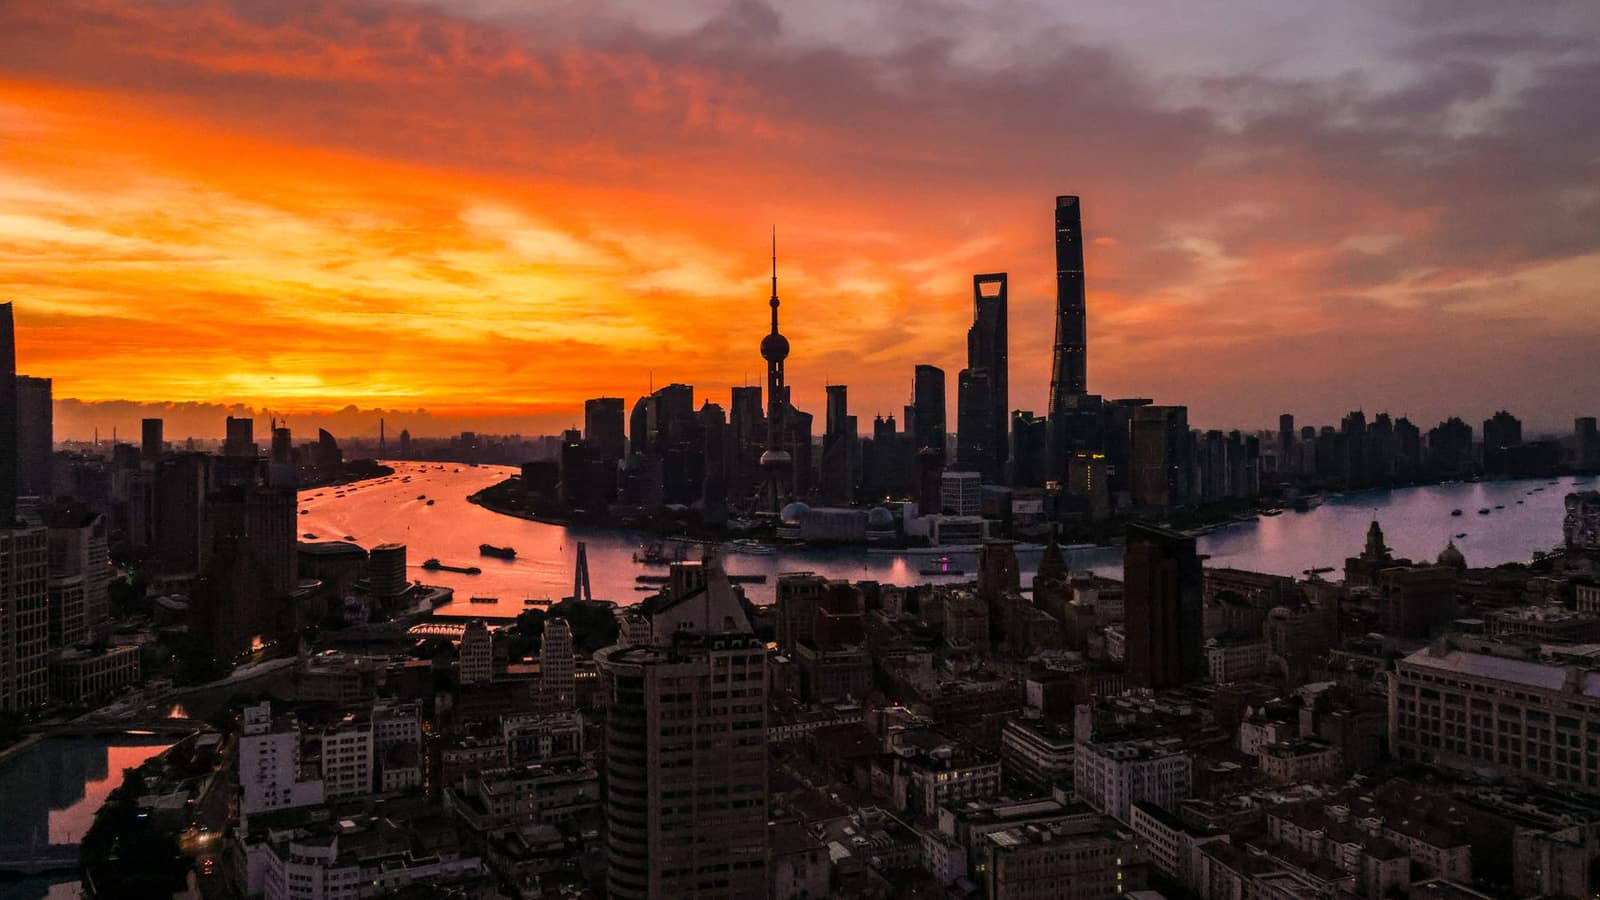
East Asia
Export to China
Huge market, but mostly for raw materials. Food plants must be registered with GACC; fresh produce needs a protocol.
- Capital
- Beijing
- Currency
- CNY
- Trade agreement with India
- Asia-Pacific Trade Agreement (APTA) China joined APTA in 2001
- Main ports
- Shanghai, Ningbo-Zhoushan, Shenzhen
India buys far more from China than it sells. What China buys from India is mainly raw and semi-processed material: iron ore, aluminium, copper, organic chemicals, cotton and yarn, marine products, chilli and granite. Consumer goods are hard to sell there. Food exporters must be registered with China's customs (GACC) before shipping.

India and China have no bilateral trade agreement. Both are APTA members, which gives small duty cuts on a limited list of goods with an APTA certificate of origin. Check China's tariff for your HS code.
What it buys from India
- Iron ore, aluminium, copper and other metals
- Organic chemicals and petroleum products
- Cotton, cotton yarn and marine products
- Chilli, spices, granite and vegetable oils
Import rules on their side
- Overseas makers of food (including seafood and spices) must be registered with GACC through its CIFER system; some categories need registration recommended by India's competent authority (for example EIC or MPEDA).
- Fresh fruit, vegetables and grains can enter only if China and India have signed a protocol for that product.
- Packaged food needs Chinese-language labels meeting Chinese national standards; some manufactured goods need CCC certification.
Practical tips
- The China International Import Expo (CIIE) in Shanghai is the main fair for foreign suppliers; India usually has a pavilion.
- Use an LC confirmed by a good bank and check the buyer carefully; disputes are hard to pursue across the border.
- Prices are very competitive — focus on raw materials and niche products where India has a natural advantage.
Trade data
India’s exports to China in numbers
From the Department of Commerce’s TradeStat (Indian financial years, April–March), the country’s imports from the world from UN Comtrade, and its basics from the World Bank.
- India’s exports here, 2025-26
- US$ 19.5 bn No. 3 of our 80 countries
- Change from 2024-25
- ↑ +36.6% US$ 14.3 bn → US$ 19.5 bn
- Share of all Indian exports
- 4.41%
- Its imports from the world
- US$ 2,585.1 bn 2024 · India’s share 0.7%
What India sells here most
By HS chapter, 2025-26. Change is against 2024-25.
What is rising and what is falling
Chapters where India sells at least US$ 5 million. Change from 2024-25 to 2025-26.
↑ High demand
- Ships and boatsUS$ 10k → US$ 161 mn↑+16,11,300%
- Electrical and electronicsUS$ 843 mn → US$ 3.18 bn↑+277.2%
- Animal feed and food residuesUS$ 130 mn → US$ 371 mn↑+185.8%
- CottonUS$ 236 mn → US$ 493 mn↑+108.9%
- CopperUS$ 368 mn → US$ 761 mn↑+106.9%
- Inorganic chemicalsUS$ 81.6 mn → US$ 163 mn↑+100.3%
- VegetablesUS$ 122 mn → US$ 239 mn↑+96%
- Fuels and petroleum productsUS$ 1.27 bn → US$ 2.46 bn↑+94%
↓ Low demand
- Coffee, tea, spicesUS$ 654 mn → US$ 451 mn↓-31%
- PlasticsUS$ 276 mn → US$ 201 mn↓-27.2%
- Fats and oilsUS$ 867 mn → US$ 769 mn↓-11.2%
Opportunity: what this country buys from the world, and from India
The country’s own recorded imports in UN Comtrade, 2024. Chapters with the biggest gap between what it buys from the world and what it buys from India.
Our product guides that sell here
India’s exports of each product to this country, 2025-26.
The 20 biggest export lines
4-digit HS lines, 2025-26, with their Harmonized System descriptions.
What India buys from China
India’s imports from this country in 2025-26 by HS chapter, from TradeStat — this country can be your supplier too.
- India’s imports, 2025-26
- US$ 131.6 bn US$ 113.4 bn → US$ 131.6 bn
- India’s exports, 2025-26
- US$ 19.5 bn
- Trade balance
- −US$ 112.1 bn exports minus imports
- Change in imports
- +16%
The country at a glance
- Population
- 1.41 bn 2025
- GDP
- US$ 19,498 bn 2025
- GDP per person
- US$ 13,862 2025
- Imports (goods and services)
- US$ 3,292.3 bn 2025
Sources: TradeStat — Export Import Data Bank, Department of Commerce · UN Comtrade database (United Nations Statistics Division) · World Bank — World Development Indicators · Figures taken 29 October 2026.
What to send to China
All products → Free to exportMarineFrozen shrimpIndia’s top seafood export. Needs MPEDA registration and an EIC-approved plant; residue testing and US trade measures shape the business.HS0306.17Exports 2025-26US$ 5.61 bn ↑9.1%
 Free to exportFarm produceChilliIndia’s largest spice export by volume. Dried red chilli goes to China, Thailand and Bangladesh; aflatoxin is the key test.HS0904.21Exports 2025-26US$ 1.1 bn ↓12.9%
 Free to exportFarm produceSpicesWhole, ground and blended spices. Spices Board registration (CRES) is compulsory; residue and ethylene oxide tests keep buyers.HS0904–0910Exports 2025-26US$ 3.12 bn ↓5.1%
 Free to exportFarm produceSesame seed (til)Natural and hulled sesame from Gujarat, Rajasthan, MP and UP. EU shipments need an IOPEPC Certificate of Export and strict residue testing.HS1207.40Exports 2025-26US$ 423 mn ↓13.8%
 Free to exportTextiles & apparelCotton yarnBulk cotton yarn sold to weaving and knitting mills abroad; Bangladesh is by far the largest buyer.HS5205Exports 2025-26US$ 3.22 bn ↓4.1%
 Free to exportOther goodsGranite and natural stonePolished granite slabs, monuments and sandstone from South India and Rajasthan; the USA leads.HS6802Exports 2025-26US$ 1.17 bn ↑0.7%
 Free to exportEngineering goodsIron and steel castingsGrey and ductile iron and steel castings from Kolhapur, Rajkot, Coimbatore and Howrah; the USA leads.HS7325Exports 2025-26US$ 1.25 bn ↑3.2%
 Free to exportFarm produceGuar gumRajasthan’s guar processed into gum for oil drilling, food and textiles. Industrial buyers set strict viscosity specs.HS1302.32Exports 2025-26US$ 393 mn ↓7.1%
More in East Asia
 CEPAJPYTokyoJapanHigh-value, quality-obsessed market. Buys shrimp, chemicals, auto parts and garments; strict food-sanitation checks.From India 2025-26US$ 6.04 bn
 CEPAKRWSeoulSouth KoreaIndustrial buyer of Indian naphtha, metals, chemicals and yarn. Food plants must register with MFDS first.From India 2025-26US$ 6.01 bn
 HKDHong Kong (Special Administrative Region of China)Hong KongFree port with almost no import duty. A top buyer of Indian diamonds and jewellery and a re-export hub for Asia.From India 2025-26US$ 8.08 bn
 TWDTaipeiTaiwanHigh-tech economy that buys Indian chemicals, metals, marine products and food. Strict food inspection and product standards.From India 2025-26US$ 1.95 bn