


Oceania
Export to Australia
Zero duty on all Indian goods since Jan 2026 — but some of the world's strictest biosecurity rules.
- Capital
- Canberra
- Currency
- AUD
- Trade agreement with India
- India–Australia Economic Cooperation and Trade Agreement (ECTA) 29 December 2022
- Main ports
- Sydney (Port Botany), Melbourne, Brisbane
Australia has a growing Indian community and now charges no customs duty on Indian goods under ECTA. It buys textiles, medicines, chemicals, gems, petroleum products, spices, coffee and marine products. The hard part is biosecurity: many plant and animal products need an import permit and treatment, and anything made of wood, bamboo or natural fibre is inspected.
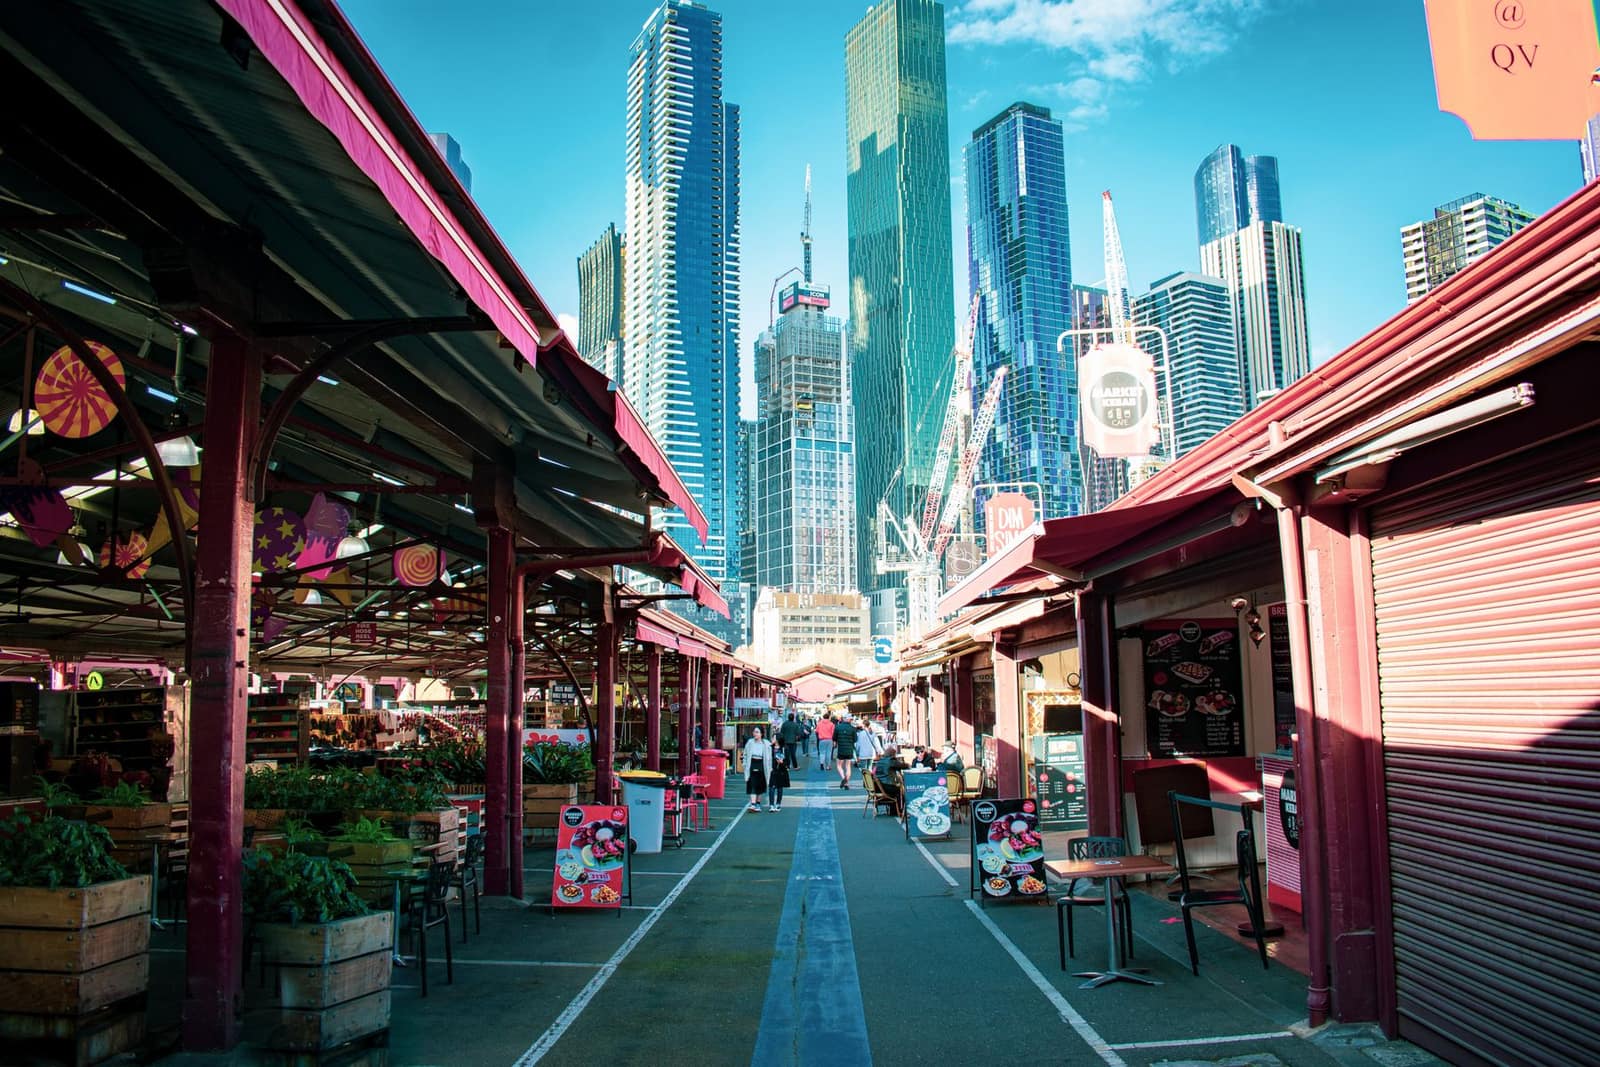
From January 2026, Indian goods enter Australia at zero duty on 100% of Australian tariff lines (PIB, Feb 2026). Get the ECTA certificate of origin from DGFT and meet the origin rules. A wider agreement (CECA) is still being negotiated.
What it buys from India
- Petroleum products, chemicals and plastics
- Medicines, gems and jewellery
- Textiles, garments and manufactured goods
- Fruit and vegetables, marine products, spices and coffee
Import rules on their side
- Check BICON (the Australian import conditions database) for your exact product before quoting. Many foods, seeds, fresh fruit and animal products need an import permit, a specific treatment or both.
- Wooden crafts, bamboo, cane and packing material are inspected for pests; wooden pallets must be ISPM 15 treated and marked.
- Imported food is checked under the Imported Food Inspection Scheme and must meet the Food Standards Code, including English labels and country-of-origin labelling.
Practical tips
- A rejected or treated consignment costs a lot in Australia. Ask the importer to confirm import conditions in writing before you ship.
- Fine Food Australia (Melbourne/Sydney) is the main food trade show.
- Australian buyers pay reliably by bank transfer; open account is common once trust is built.
Sources (6)
- PIB — India-Australia ECTA comes into force (29 Dec 2022)
- PIB backgrounder — India's Trade Partnerships (27 Feb 2026)
- Australian Government DAFF — BICON import conditions database
- Australian Border Force — importing
- Food Standards Australia New Zealand
- Department of Commerce — TradeStat export-import data bank
Trade data
India’s exports to Australia in numbers
From the Department of Commerce’s TradeStat (Indian financial years, April–March), the country’s imports from the world from UN Comtrade, and its basics from the World Bank.
- India’s exports here, 2025-26
- US$ 7.28 bn No. 12 of our 30 countries
- Change from 2024-25
- ↓ -15.1% US$ 8.58 bn → US$ 7.28 bn
- Share of all Indian exports
- 1.65%
- Its imports from the world
- US$ 287.9 bn 2023 · India’s share 2.19%
What India sells here most
By HS chapter, 2025-26. Change is against 2024-25.
What is rising and what is falling
Chapters where India sells at least US$ 5 million. Change from 2024-25 to 2025-26.
↑ High demand
- MachineryUS$ 332 mn → US$ 605 mn↑+82.1%
- Fats and oilsUS$ 33.9 mn → US$ 48.8 mn↑+44%
- Iron and steelUS$ 50.9 mn → US$ 67 mn↑+31.7%
- AluminiumUS$ 43.5 mn → US$ 55.8 mn↑+28.2%
- Instruments, medical devicesUS$ 56 mn → US$ 71.2 mn↑+27.1%
- Fruit and vegetable preparationsUS$ 39.7 mn → US$ 47.3 mn↑+19.2%
- Gems, jewellery, precious metalsUS$ 323 mn → US$ 374 mn↑+16%
- Toys, games, sports goodsUS$ 33.7 mn → US$ 38.4 mn↑+13.9%
↓ Low demand
- Fuels and petroleum productsUS$ 4.49 bn → US$ 2.71 bn↓-39.5%
Opportunity: what this country buys from the world, and from India
The country’s own recorded imports in UN Comtrade, 2023. Chapters with the biggest gap between what it buys from the world and what it buys from India.
Our product guides that sell here
India’s exports of each product to this country, 2025-26.
The 20 biggest export lines
4-digit HS lines, 2025-26, with their Harmonized System descriptions.
What India buys from Australia
India’s imports from this country in 2025-26 by HS chapter, from TradeStat — this country can be your supplier too.
- India’s imports, 2025-26
- US$ 13.8 bn US$ 15.5 bn → US$ 13.8 bn
- India’s exports, 2025-26
- US$ 7.28 bn
- Trade balance
- −US$ 6.53 bn exports minus imports
- Change in imports
- -11.1%
The country at a glance
- Population
- 27.6 mn 2025
- GDP
- US$ 1,798.5 bn 2025
- GDP per person
- US$ 65,130 2025
- Imports (goods and services)
- US$ 407.5 bn 2025
Sources: TradeStat — Export Import Data Bank, Department of Commerce · UN Comtrade database (United Nations Statistics Division) · World Bank — World Development Indicators · Figures taken 29 October 2026.
What to send to Australia
All products → Free to exportTextiles & apparelReadymade garmentsKnitted and woven clothing for brands and retailers; the USA, UK, UAE and the EU are the big buyers.HS6109.10Exports 2025-26US$ 15.8 bn ↓1.2%
 Free to exportTextiles & apparelHome textiles (bed, bath and kitchen linen)Bedsheets, towels and kitchen linen for retailers; the USA buys more than half of India's exports.HS6302Exports 2025-26US$ 2.01 bn ↓5.7%
 Free to exportPharma & chemicalsGeneric medicines (formulations)Tablets, capsules and injectables; every market needs product registration. The USA buys the most.HS3004Exports 2025-26US$ 21.9 bn ↓0.7%
 Free to exportFarm produceSpicesWhole, ground and blended spices. Spices Board registration (CRES) is compulsory; residue and ethylene oxide tests keep buyers.HS0904–0910Exports 2025-26US$ 3.12 bn ↓5.1%
 Free to exportProcessed foodTeaAssam, Darjeeling, Nilgiri and CTC tea. You need a Tea Board exporter licence; residues and GI rules matter.HS0902Exports 2025-26US$ 899 mn ↑8%
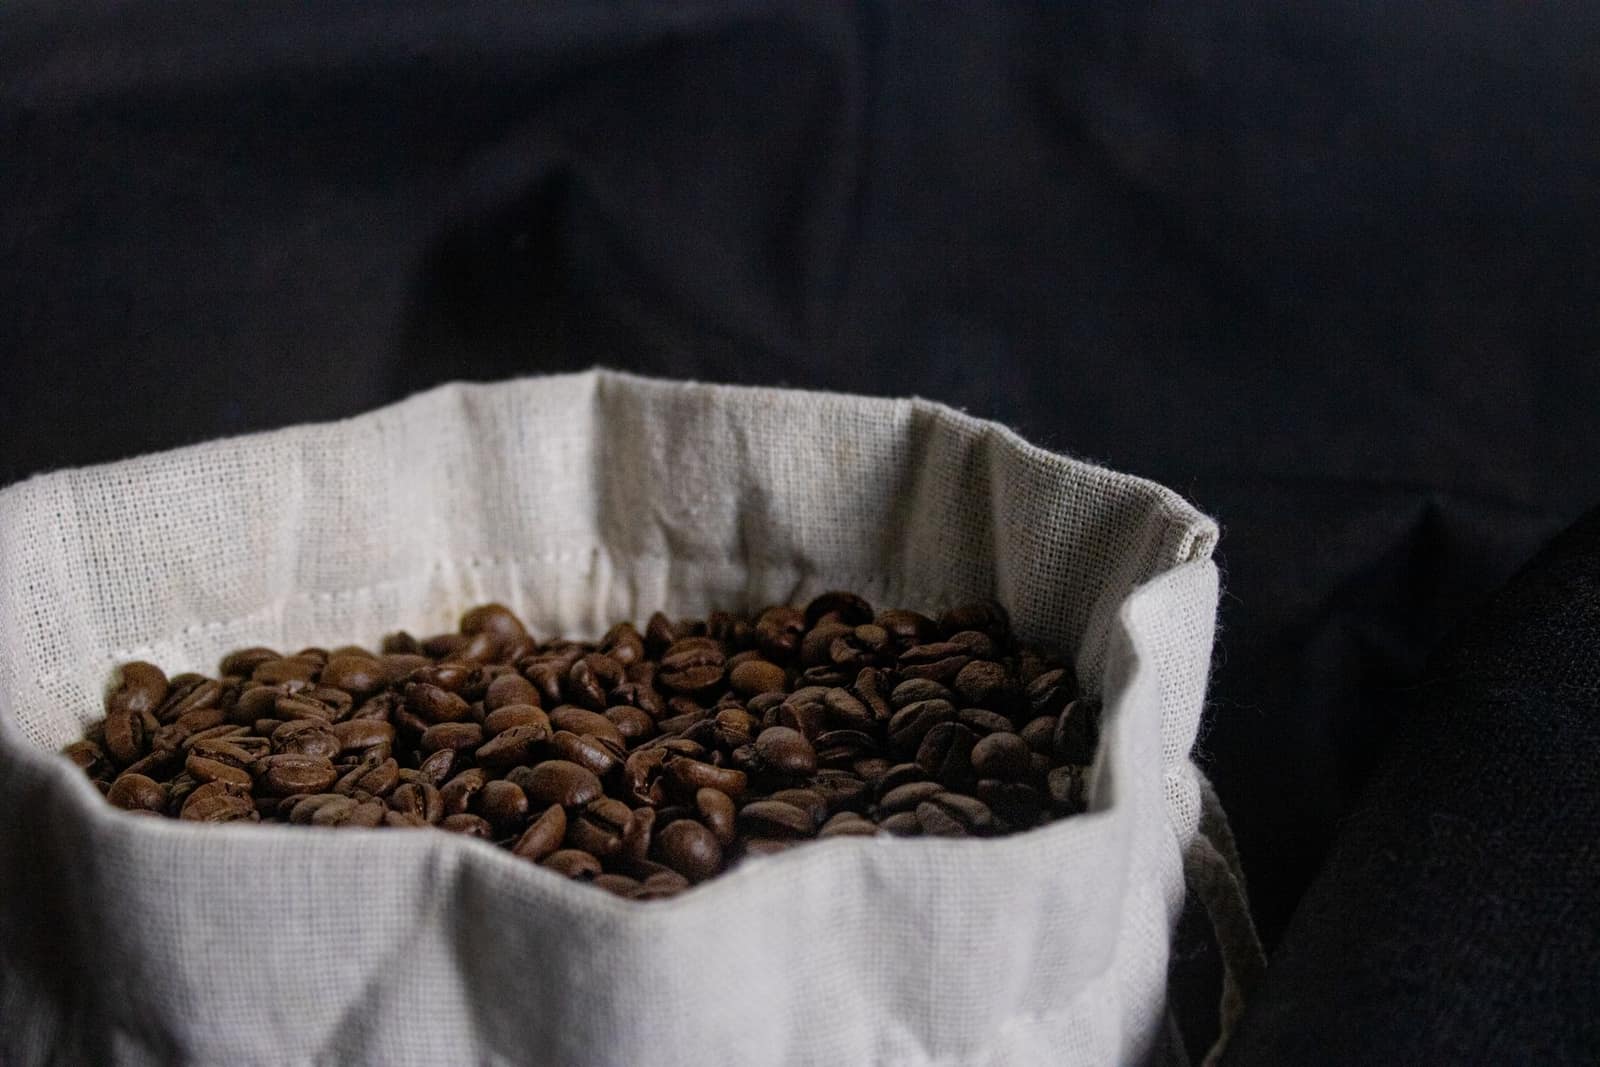 Free to exportProcessed foodCoffeeArabica and Robusta green beans, monsooned and instant coffee. Coffee Board registration and an export permit for every shipment.HS0901.11Exports 2025-26US$ 1.41 bn ↑13%
 Free to exportProcessed foodProcessed foodSnacks, pickles, ready-to-eat meals, sauces, biscuits and mixes. FSSAI licence plus the buyer country’s labelling and registration rules.HS19–21Exports 2025-26US$ 4.19 bn ↑8.9%
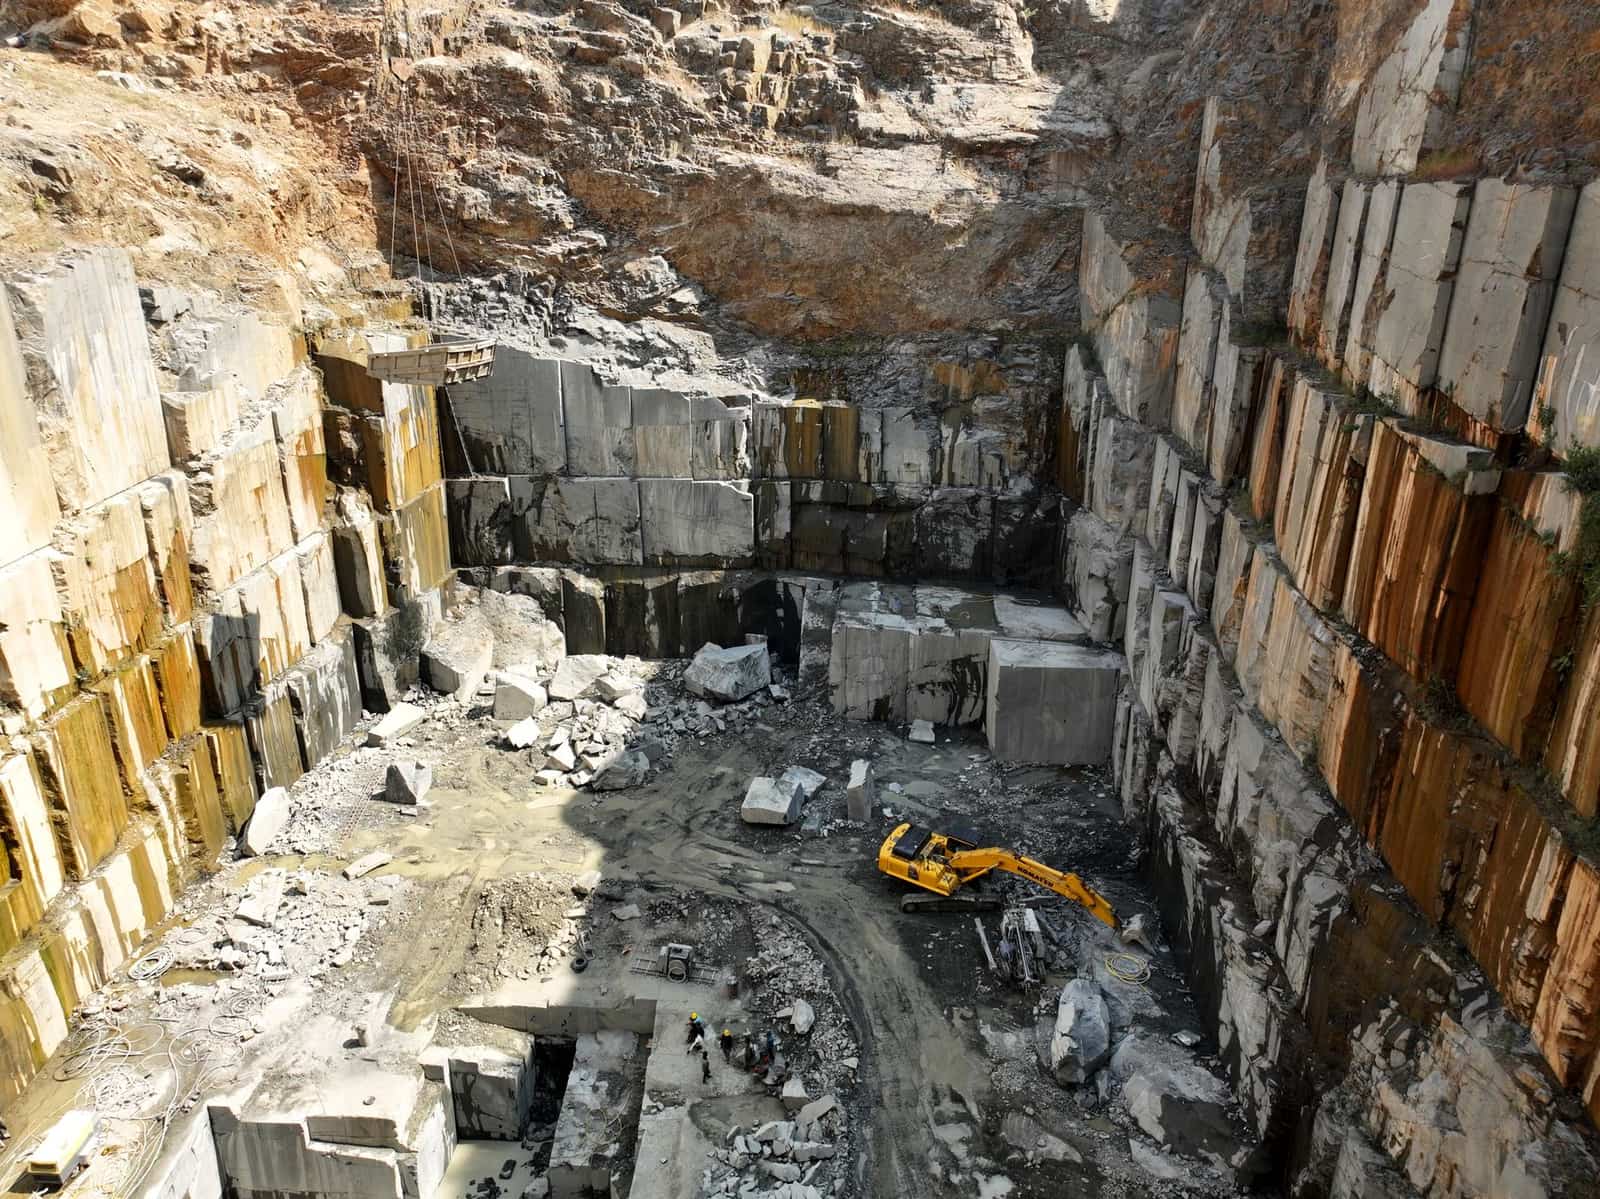 Free to exportOther goodsGranite and natural stonePolished granite slabs, monuments and sandstone from South India and Rajasthan; the USA leads.HS6802Exports 2025-26US$ 1.17 bn ↑0.7%