


Europe
Export to Russia
Growing buyer of Indian food, medicines and machinery. Payments need care because of sanctions; EAC certification applies.
- Capital
- Moscow
- Currency
- RUB
- Trade agreement with India
- India–Eurasian Economic Union FTA (under negotiation) Not in force yetNot in force
- Main ports
- St Petersburg, Novorossiysk, Vladivostok
Since 2022 Russia has bought more from India — medicines, machinery, auto parts, marine products, tea, coffee, fruit and vegetables. The main challenge is payment: many Western banks avoid Russian transactions, so trade often uses rupee settlement through Special Rupee Vostro Accounts allowed by the RBI. Products must meet Eurasian Economic Union technical regulations.
There is no trade agreement in force; Eurasian Economic Union (EAEU) common duties apply. India and the EAEU (Russia, Belarus, Kazakhstan, Kyrgyzstan, Armenia) signed terms of reference in August 2025 to start FTA negotiations. Confirm current status on commerce.gov.in.
What it buys from India
- Medicines and pharmaceutical products
- Machinery, electrical goods and auto parts
- Marine products, tea, coffee, fruit and vegetables
- Chemicals, iron and steel goods and garments
Import rules on their side
- Most manufactured goods need EAEU conformity documents (a declaration or certificate) and the EAC mark under the union's technical regulations.
- Marine, dairy and meat plants must be on the list approved by Rosselkhoznadzor (FSVPS); plant products need phytosanitary certificates and are checked at entry.
- Labels must be in Russian.
Practical tips
- Agree the payment route with your bank before you sign. Check that the buyer and its bank are not on sanctions lists your bank follows.
- Prodexpo and WorldFood Moscow are the main food fairs.
- Shipping takes longer and costs more than before 2022; compare the Suez route, the North–South corridor and transhipment options.
Sources (5)
- All India Radio News — India and EAEU sign ToR to begin FTA negotiations (Aug 2025)
- RBI — International Trade Settlement in Indian Rupees (INR), July 2022
- Federal Service for Veterinary and Phytosanitary Surveillance (Rosselkhoznadzor)
- Federal Customs Service of Russia
- Department of Commerce — TradeStat export-import data bank
Trade data
India’s exports to Russia in numbers
From the Department of Commerce’s TradeStat (Indian financial years, April–March), the country’s imports from the world from UN Comtrade, and its basics from the World Bank.
- India’s exports here, 2025-26
- US$ 4.49 bn No. 29 of our 80 countries
- Change from 2024-25
- ↓ -7.9% US$ 4.88 bn → US$ 4.49 bn
- Share of all Indian exports
- 1.02%
- Its imports from the world
- —
What India sells here most
By HS chapter, 2025-26. Change is against 2024-25.
What is rising and what is falling
Chapters where India sells at least US$ 5 million. Change from 2024-25 to 2025-26.
↑ High demand
- MeatUS$ 35.8 mn → US$ 97.5 mn↑+172.8%
- AircraftUS$ 26.5 mn → US$ 62.7 mn↑+136.1%
- TobaccoUS$ 44.1 mn → US$ 85.1 mn↑+93%
- Paper and paperboardUS$ 23 mn → US$ 39.9 mn↑+73.8%
- Other food preparationsUS$ 94.6 mn → US$ 156 mn↑+65.3%
- VegetablesUS$ 38.4 mn → US$ 54.4 mn↑+41.5%
- FootwearUS$ 31 mn → US$ 40.9 mn↑+32%
- Fish and seafoodUS$ 123 mn → US$ 159 mn↑+29.3%
↓ Low demand
- Iron and steel articlesUS$ 71.8 mn → US$ 40 mn↓-44.3%
- MachineryUS$ 1.14 bn → US$ 660 mn↓-42%
- Vehicles and partsUS$ 47.3 mn → US$ 37 mn↓-21.9%
- Oilseeds and seedsUS$ 75.5 mn → US$ 59.6 mn↓-21%
- Inorganic chemicalsUS$ 244 mn → US$ 197 mn↓-19.3%
- Cereals (rice, wheat, maize)US$ 85.2 mn → US$ 69.1 mn↓-18.8%
- Tools and cutleryUS$ 45.3 mn → US$ 37.9 mn↓-16.4%
- Iron and steelUS$ 131 mn → US$ 110 mn↓-16.2%
Our product guides that sell here
India’s exports of each product to this country, 2025-26.
The 20 biggest export lines
4-digit HS lines, 2025-26, with their Harmonized System descriptions.
What India buys from Russia
India’s imports from this country in 2025-26 by HS chapter, from TradeStat — this country can be your supplier too.
- India’s imports, 2025-26
- US$ 55.4 bn US$ 63.8 bn → US$ 55.4 bn
- India’s exports, 2025-26
- US$ 4.49 bn
- Trade balance
- −US$ 50.9 bn exports minus imports
- Change in imports
- -13.2%
The country at a glance
- Population
- 144 mn 2025
- GDP
- US$ 2,561.3 bn 2025
- GDP per person
- US$ 17,547 2025
- Imports (goods and services)
- US$ 397.2 bn 2025
Sources: TradeStat — Export Import Data Bank, Department of Commerce · World Bank — World Development Indicators · Figures taken 29 October 2026.
What to send to Russia
All products →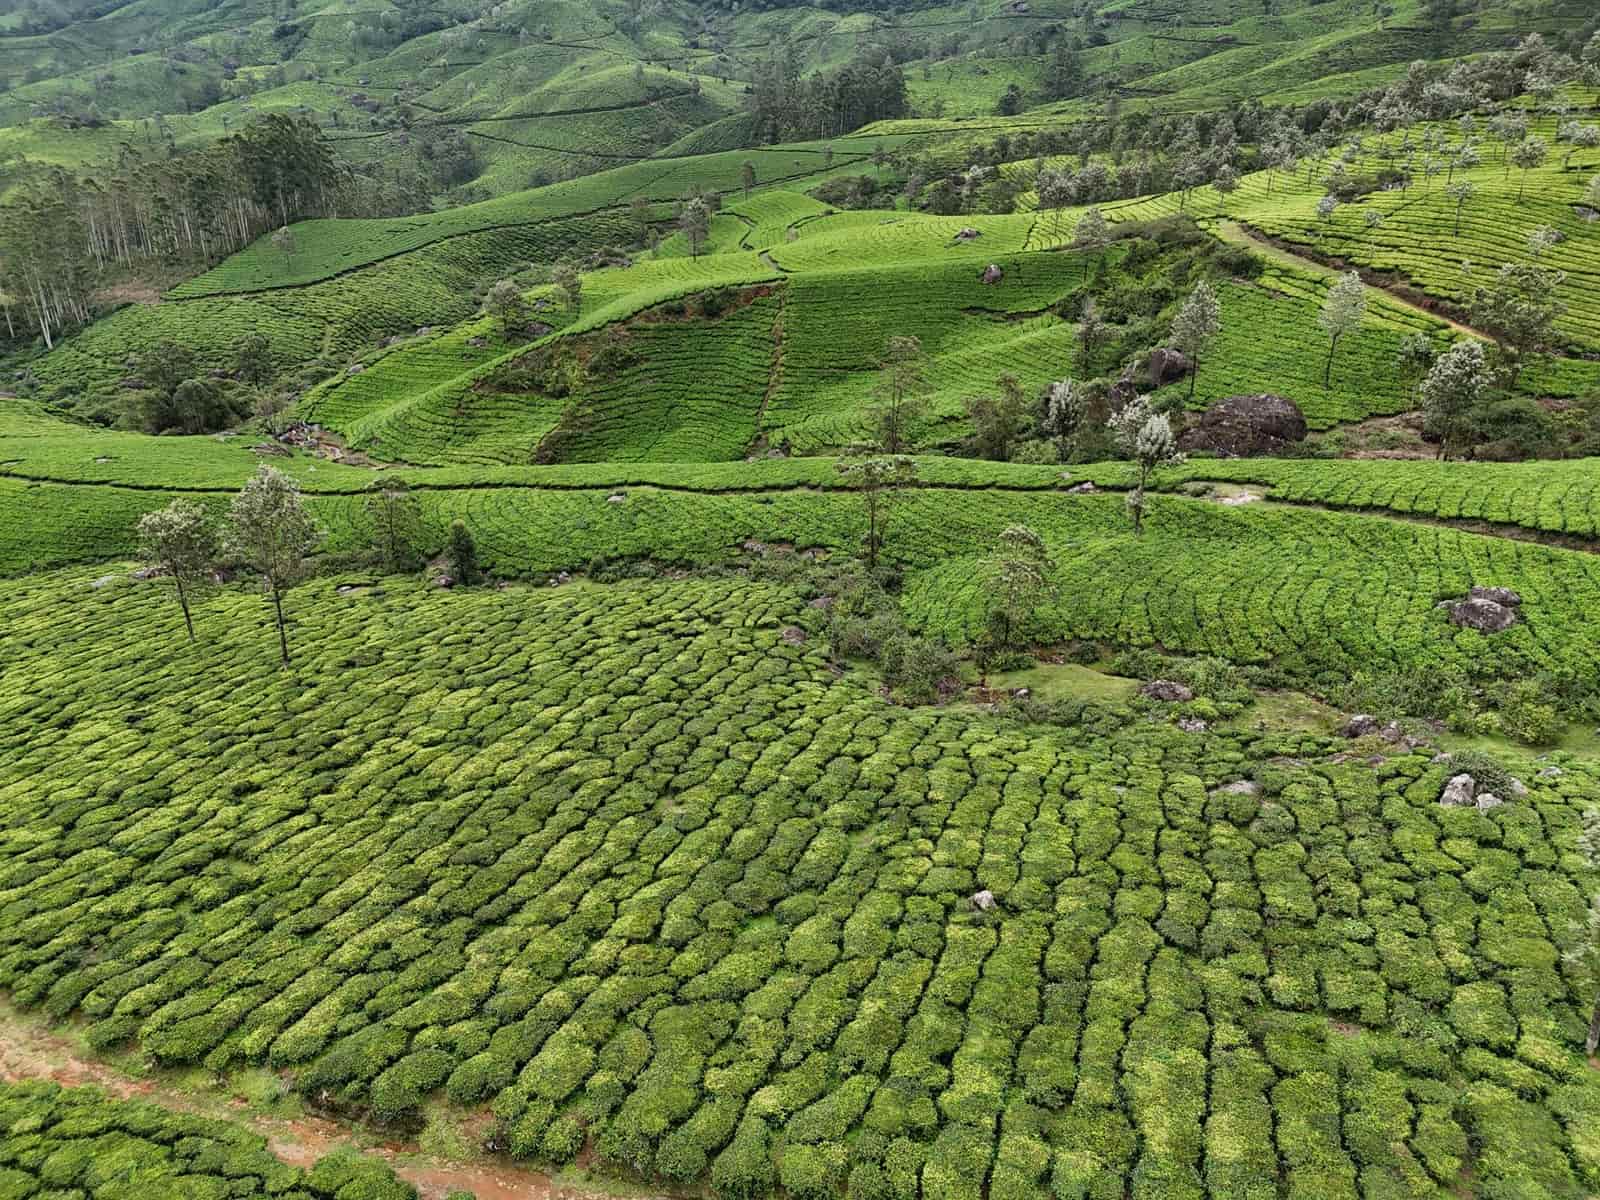 Free to exportProcessed foodTeaAssam, Darjeeling, Nilgiri and CTC tea. You need a Tea Board exporter licence; residues and GI rules matter.HS0902Exports 2025-26US$ 899 mn ↑8%
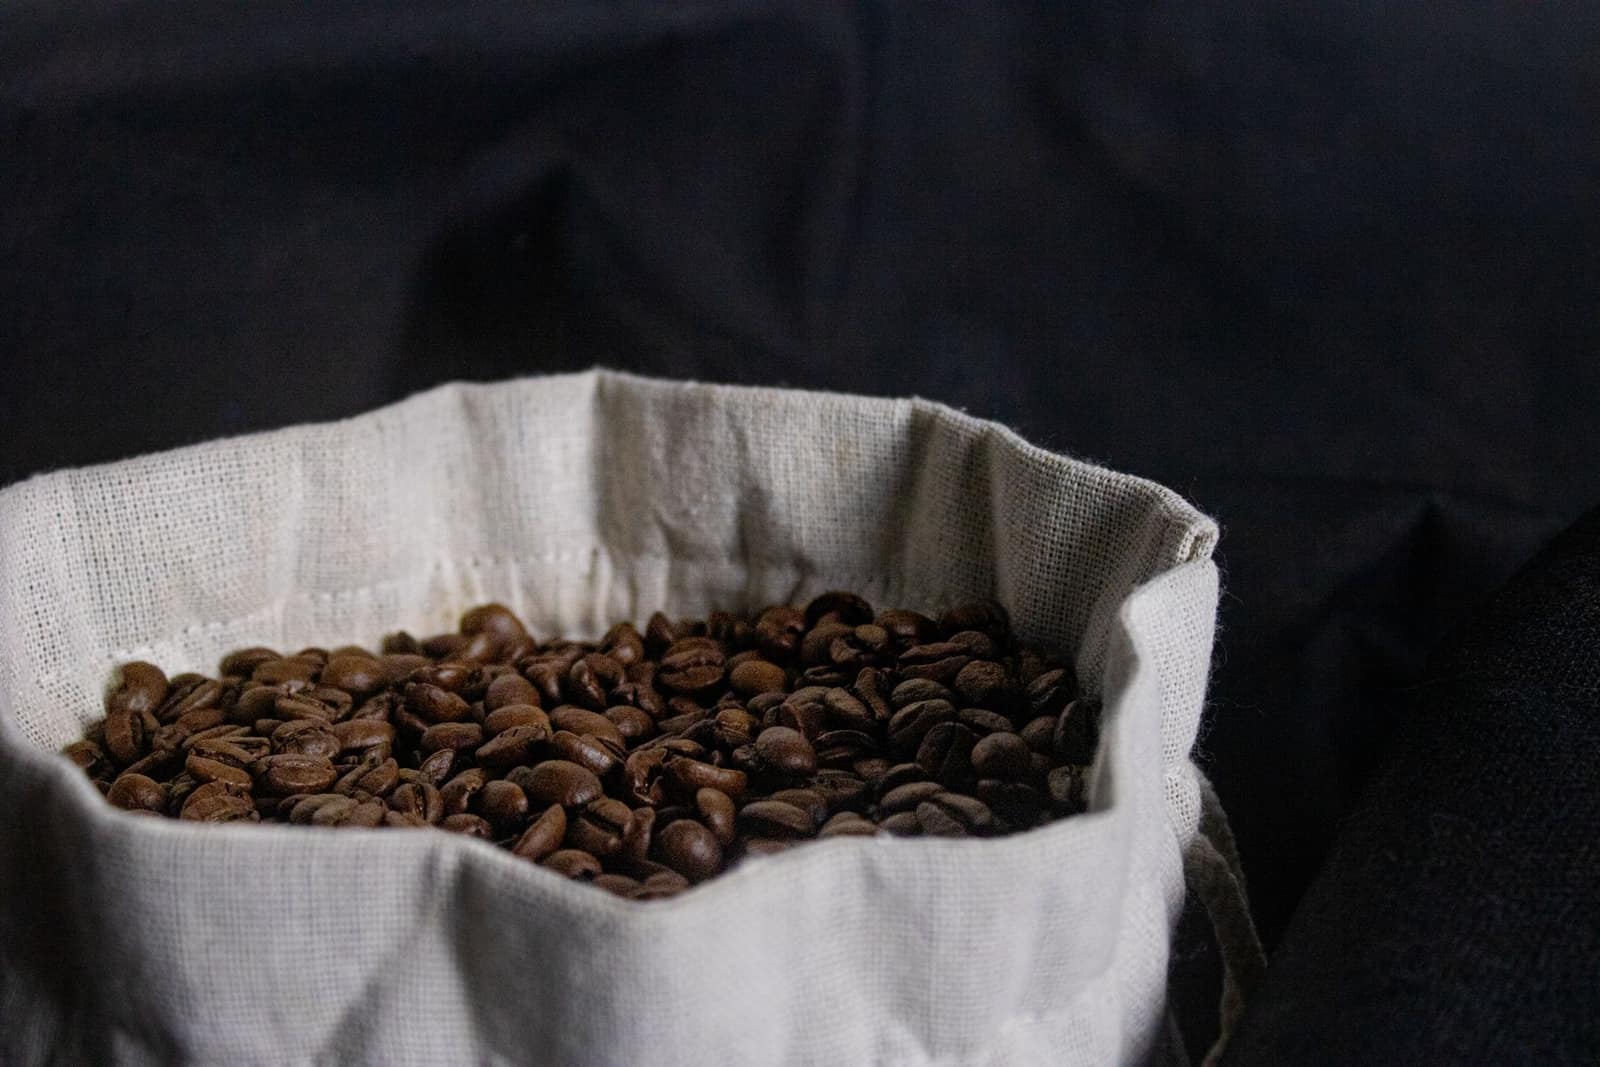 Free to exportProcessed foodCoffeeArabica and Robusta green beans, monsooned and instant coffee. Coffee Board registration and an export permit for every shipment.HS0901.11Exports 2025-26US$ 1.41 bn ↑13%
 Free to exportMarineFrozen shrimpIndia’s top seafood export. Needs MPEDA registration and an EIC-approved plant; residue testing and US trade measures shape the business.HS0306.17Exports 2025-26US$ 5.61 bn ↑9.1%
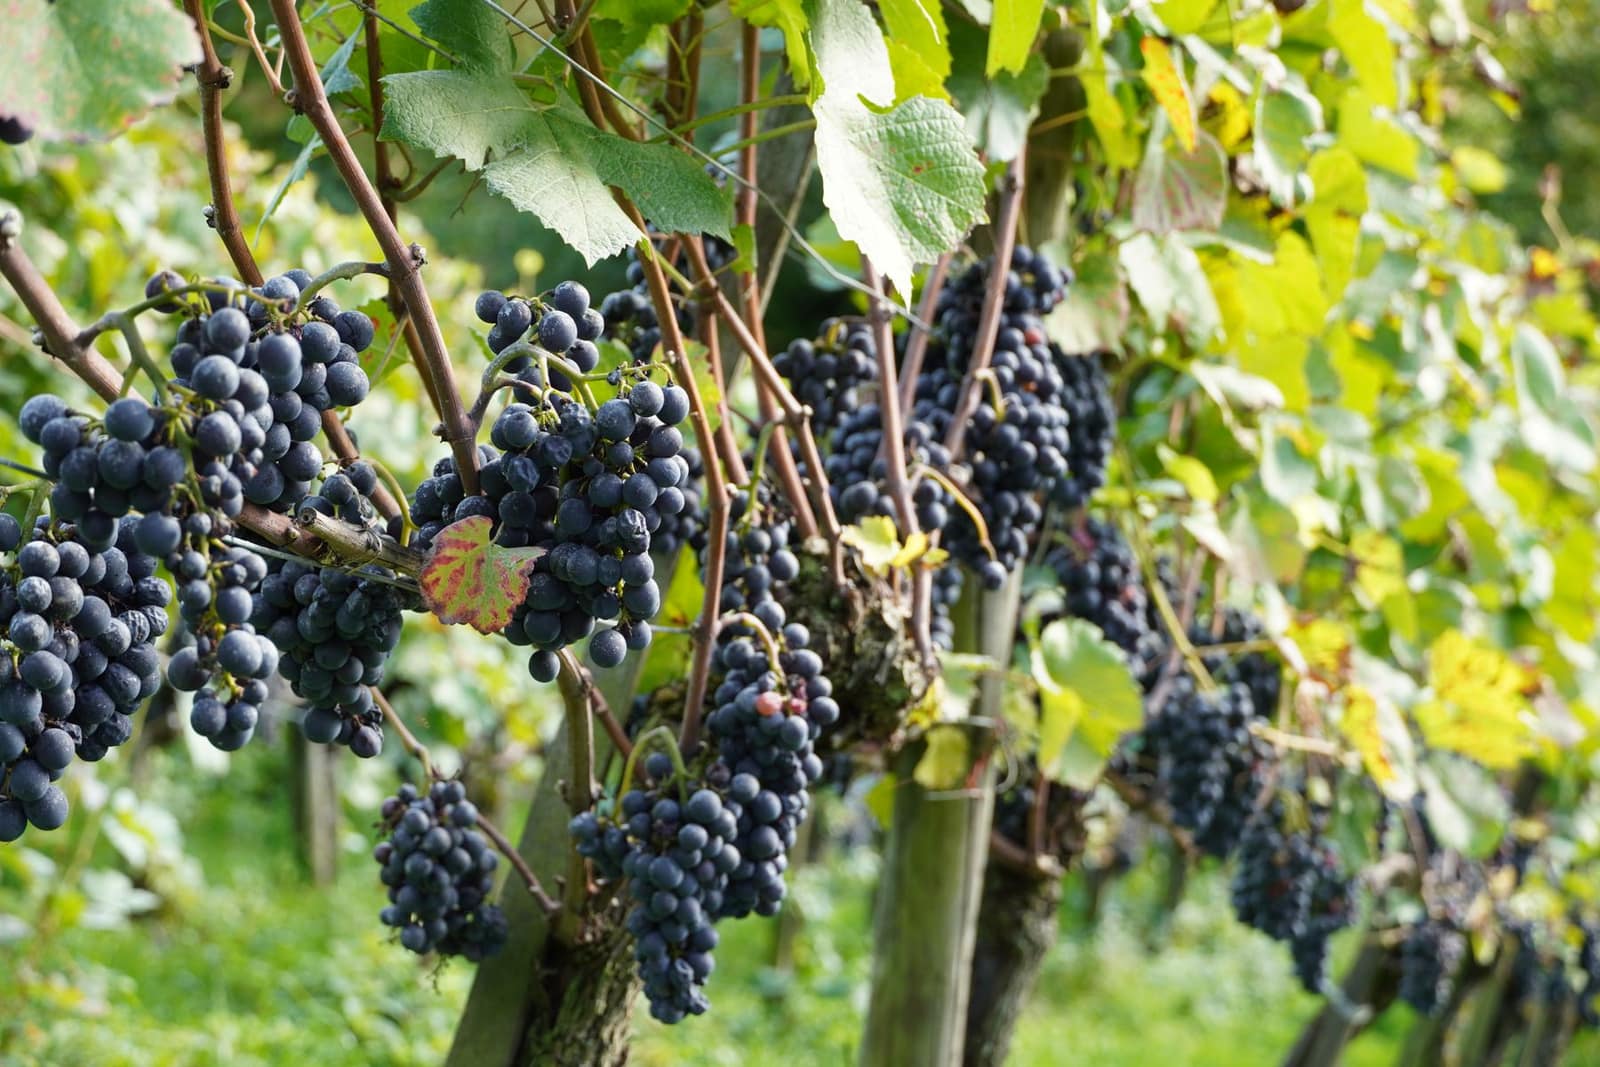 Free to exportFarm produceFresh grapesThompson Seedless and coloured grapes from Nashik and Sangli, mainly to Europe and Russia. EU lots must clear GrapeNet.HS0806.10Exports 2025-26US$ 368 mn ↑3.9%
 Free to exportFarm produceFresh pomegranateBhagwa pomegranate from Maharashtra for the Gulf, Europe and new markets. AnarNet traceability is required for the EU.HS0810.90Exports 2025-26US$ 121 mn ↑19%
 Free to exportFarm produceFresh vegetablesOkra, green chilli, drumstick, gourds and potatoes for Gulf and UK ethnic markets. Fast, perishable and residue-sensitive.HS07Exports 2025-26US$ 2.26 bn ↑3%
 Free to exportFarm produceSpicesWhole, ground and blended spices. Spices Board registration (CRES) is compulsory; residue and ethylene oxide tests keep buyers.HS0904–0910Exports 2025-26US$ 3.12 bn ↓5.1%
 Free to exportPharma & chemicalsGeneric medicines (formulations)Tablets, capsules and injectables; every market needs product registration. The USA buys the most.HS3004Exports 2025-26US$ 21.9 bn ↓0.7%
More in Europe
 CETAGBPLondonUnited KingdomNew CETA in force since July 2026 — most Indian goods now enter duty-free. Strong market for garments, food and engineering.From India 2025-26US$ 13.4 bn
 EURAmsterdamNetherlandsEurope's main gateway: Rotterdam handles goods for the whole EU. EU food-safety and residue rules apply.From India 2025-26US$ 17.5 bn
 EURBerlinGermanyEurope's largest economy and India's biggest EU partner. Values quality, certificates and supply-chain transparency.From India 2025-26US$ 11.5 bn
 EURParisFranceFashion, food and design market. EU rules plus French-language labels; SIAL Paris is a key food fair.From India 2025-26US$ 7.1 bn