

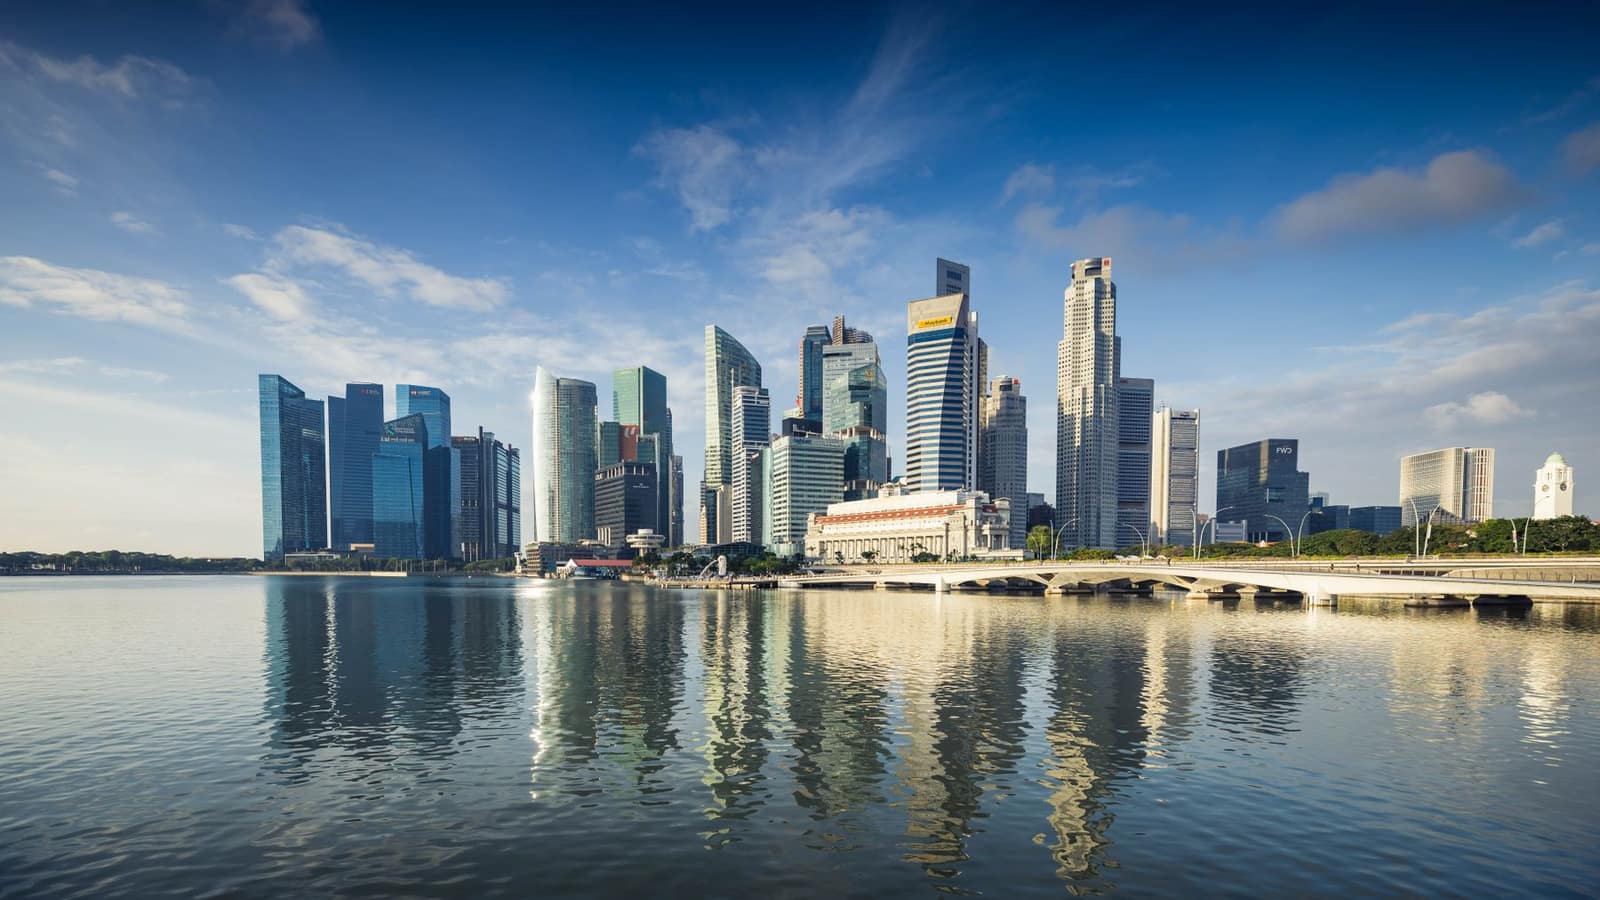
South-East Asia
Export to Singapore
Duty-free trading hub for South-East Asia. Strict food licensing by SFA; big Indian community.
- Capital
- Singapore
- Currency
- SGD
- Trade agreement with India
- India–Singapore Comprehensive Economic Cooperation Agreement (CECA); also ASEAN–India Trade in Goods Agreement (AITIGA) 1 August 2005
- Main ports
- Port of Singapore (PSA terminals), Changi Airport
Singapore is a small country but a big trading and transhipment hub. Its traders buy Indian goods for their own market and for re-export across South-East Asia. Almost all goods enter without customs duty (only GST is charged), but food imports are tightly controlled by the Singapore Food Agency.

Singapore charges almost no customs duty on most goods anyway, so the CECA matters more for services, investment and mutual recognition. A third review of the CECA was launched in 2018 and AITIGA is also under review; confirm current status on commerce.gov.in.
What it buys from India
- Petroleum products
- Electronics, machinery and ships and parts
- Gems and jewellery, chemicals and medicines
- Rice, spices, fresh vegetables and Indian groceries
Import rules on their side
- Only importers licensed by the Singapore Food Agency (SFA) can import food, and every consignment needs an import permit through TradeNet.
- Meat, seafood and eggs can only come from countries and plants accredited by SFA; check before you quote.
- Food labels must be in English and follow Singapore's food regulations; health products and cosmetics need notification or registration with the Health Sciences Authority.
Practical tips
- Air freight from Chennai, Kochi or Tiruchirappalli suits fresh vegetables and flowers for the Indian community market.
- Singapore buyers are price-sharp and pay on time; open account after a few orders is normal.
- A Singapore distributor can be your base to reach Malaysia, Indonesia and Vietnam.
Trade data
India’s exports to Singapore in numbers
From the Department of Commerce’s TradeStat (Indian financial years, April–March), the country’s imports from the world from UN Comtrade, and its basics from the World Bank.
- India’s exports here, 2025-26
- US$ 11.9 bn No. 6 of our 80 countries
- Change from 2024-25
- ↓ -8.6% US$ 13 bn → US$ 11.9 bn
- Share of all Indian exports
- 2.69%
- Its imports from the world
- US$ 457.5 bn 2024 · India’s share 1.93%
What India sells here most
By HS chapter, 2025-26. Change is against 2024-25.
What is rising and what is falling
Chapters where India sells at least US$ 5 million. Change from 2024-25 to 2025-26.
↑ High demand
- Fats and oilsUS$ 33.8 mn → US$ 68.7 mn↑+103.2%
- LeadUS$ 209 mn → US$ 383 mn↑+83.5%
- Electrical and electronicsUS$ 387 mn → US$ 479 mn↑+23.6%
- ZincUS$ 112 mn → US$ 126 mn↑+12.6%
- Essential oils, cosmeticsUS$ 103 mn → US$ 115 mn↑+12.4%
- MachineryUS$ 1.94 bn → US$ 2.13 bn↑+10.2%
↓ Low demand
- Organic chemicalsUS$ 1.07 bn → US$ 654 mn↓-38.8%
- PlasticsUS$ 115 mn → US$ 87.4 mn↓-24%
- Ships and boatsUS$ 1.81 bn → US$ 1.41 bn↓-22.4%
- Instruments, medical devicesUS$ 302 mn → US$ 242 mn↓-19.9%
- Cereals (rice, wheat, maize)US$ 110 mn → US$ 89.6 mn↓-18.9%
- Fuels and petroleum productsUS$ 5.28 bn → US$ 4.47 bn↓-15.3%
- AircraftUS$ 78.5 mn → US$ 69.6 mn↓-11.3%
Opportunity: what this country buys from the world, and from India
The country’s own recorded imports in UN Comtrade, 2024. Chapters with the biggest gap between what it buys from the world and what it buys from India.
Our product guides that sell here
India’s exports of each product to this country, 2025-26.
The 20 biggest export lines
4-digit HS lines, 2025-26, with their Harmonized System descriptions.
What India buys from Singapore
India’s imports from this country in 2025-26 by HS chapter, from TradeStat — this country can be your supplier too.
- India’s imports, 2025-26
- US$ 24.2 bn US$ 21.3 bn → US$ 24.2 bn
- India’s exports, 2025-26
- US$ 11.9 bn
- Trade balance
- −US$ 12.4 bn exports minus imports
- Change in imports
- +13.9%
The country at a glance
- Population
- 6.1 mn 2025
- GDP
- US$ 603.9 bn 2025
- GDP per person
- US$ 98,814 2025
- Imports (goods and services)
- US$ 860.2 bn 2025
Sources: TradeStat — Export Import Data Bank, Department of Commerce · UN Comtrade database (United Nations Statistics Division) · World Bank — World Development Indicators · Figures taken 29 October 2026.
What to send to Singapore
All products → Free, with conditionsFarm produceBasmati riceIndia’s top agri export by value. Free to export, but every contract must be registered with APEDA first.HS1006.30Exports 2025-26US$ 5.67 bn ↓4.6%
 Free to exportFarm produceSpicesWhole, ground and blended spices. Spices Board registration (CRES) is compulsory; residue and ethylene oxide tests keep buyers.HS0904–0910Exports 2025-26US$ 3.12 bn ↓5.1%
 Free to exportFarm produceFresh vegetablesOkra, green chilli, drumstick, gourds and potatoes for Gulf and UK ethnic markets. Fast, perishable and residue-sensitive.HS07Exports 2025-26US$ 2.26 bn ↑3%
 Free to exportFarm produceFresh onionBig-volume fresh export to Asia and the Gulf. Policy swings with domestic prices — check DGFT and CBIC before every season.HS0703.10Exports 2025-26US$ 430 mn ↓8.3%
 Free to exportProcessed foodProcessed foodSnacks, pickles, ready-to-eat meals, sauces, biscuits and mixes. FSSAI licence plus the buyer country’s labelling and registration rules.HS19–21Exports 2025-26US$ 4.19 bn ↑8.9%
 Free to exportMarineFrozen shrimpIndia’s top seafood export. Needs MPEDA registration and an EIC-approved plant; residue testing and US trade measures shape the business.HS0306.17Exports 2025-26US$ 5.61 bn ↑9.1%
 Free to exportPharma & chemicalsGeneric medicines (formulations)Tablets, capsules and injectables; every market needs product registration. The USA buys the most.HS3004Exports 2025-26US$ 21.9 bn ↓0.7%
 Free to exportTextiles & apparelReadymade garmentsKnitted and woven clothing for brands and retailers; the USA, UK, UAE and the EU are the big buyers.HS6109.10Exports 2025-26US$ 15.8 bn ↓1.2%
More in South-East Asia
 CECAMYRKuala LumpurMalaysiaMulti-ethnic market with a large Indian-origin community. Halal expectations for food; CECA and AITIGA both apply.From India 2025-26US$ 6.83 bn
 AITIGAVNDHanoiVietnamFast-growing manufacturing economy buying raw materials, yarn, steel, chemicals and feed ingredients from India.From India 2025-26US$ 6.67 bn
 AITIGAIDRJakartaIndonesiaWorld's fourth most populous country. Buys Indian vehicles, steel, chemicals, groundnuts and meat; halal and BPOM rules for food.From India 2025-26US$ 4.49 bn
 AITIGAMMKNaypyitawMyanmarNeighbour reached by sea and through land borders in Manipur and Mizoram. Buys Indian medicines, sugar and steel; import licences apply.From India 2025-26US$ 808 mn