


South-East Asia
Export to Malaysia
Multi-ethnic market with a large Indian-origin community. Halal expectations for food; CECA and AITIGA both apply.
- Capital
- Kuala Lumpur
- Currency
- MYR
- Trade agreement with India
- India–Malaysia Comprehensive Economic Cooperation Agreement (CECA); also AITIGA 1 July 2011
- Main ports
- Port Klang, Tanjung Pelepas, Penang
Malaysia buys Indian food, meat, chemicals, aluminium, petroleum products and engineering goods. About seven percent of the population is of Indian origin, which supports demand for Indian groceries, spices and festival goods. Most consumers are Muslim, so halal certification is expected for most food.
Under the CECA, Malaysia gives concessions beyond those in the ASEAN–India goods agreement (AITIGA). Ask your buyer which agreement gives the lower duty for your HS code and get the matching certificate of origin. AITIGA is under review; confirm current status on commerce.gov.in.
What it buys from India
- Petroleum products, aluminium and chemicals
- Meat, rice, sugar, spices and marine products
- Machinery, electrical goods and auto parts
- Medicines and textiles
Import rules on their side
- Plant and animal products are inspected by MAQIS at the border and need the right Indian phytosanitary or health certificate.
- Buyers usually want a halal certificate from a body recognised by JAKIM for food, and meat plants must be approved by Malaysia's veterinary services.
- Food labels must be in Bahasa Malaysia (English may be added). Some electrical and building products need SIRIM certification.
Practical tips
- Deepavali and Thaipusam are peak seasons for Indian food and goods — ship a few weeks early.
- MIHAS in Kuala Lumpur is a large halal trade show, useful for food exporters.
- Business is done in English; payment by telegraphic transfer or LC is common.
Sources (7)
- Department of Commerce — Annual Report 2024-25 (trade agreements chapter)
- PIB backgrounder — India's Trade Partnerships (27 Feb 2026)
- Royal Malaysian Customs Department
- Malaysian Quarantine and Inspection Services (MAQIS)
- Malaysia Halal portal (JAKIM)
- SIRIM QAS International, Malaysia
- Department of Commerce — TradeStat export-import data bank
Trade data
India’s exports to Malaysia in numbers
From the Department of Commerce’s TradeStat (Indian financial years, April–March), the country’s imports from the world from UN Comtrade, and its basics from the World Bank.
- India’s exports here, 2025-26
- US$ 6.83 bn No. 16 of our 30 countries
- Change from 2024-25
- ↓ -6.7% US$ 7.32 bn → US$ 6.83 bn
- Share of all Indian exports
- 1.55%
- Its imports from the world
- US$ 299.5 bn 2024 · India’s share 2.29%
What India sells here most
By HS chapter, 2025-26. Change is against 2024-25.
What is rising and what is falling
Chapters where India sells at least US$ 5 million. Change from 2024-25 to 2025-26.
↑ High demand
- Ships and boatsUS$ 32.3 mn → US$ 90.3 mn↑+179.4%
- Oilseeds and seedsUS$ 72.9 mn → US$ 104 mn↑+42.6%
- Instruments, medical devicesUS$ 68.7 mn → US$ 96.9 mn↑+40.9%
- Fish and seafoodUS$ 93 mn → US$ 127 mn↑+36.2%
- Electrical and electronicsUS$ 171 mn → US$ 231 mn↑+35.3%
- VegetablesUS$ 102 mn → US$ 137 mn↑+34.1%
- Fruit and vegetable preparationsUS$ 30.1 mn → US$ 39.9 mn↑+32.3%
- Fats and oilsUS$ 77.8 mn → US$ 101 mn↑+29.2%
↓ Low demand
- Fuels and petroleum productsUS$ 2.66 bn → US$ 1.71 bn↓-35.7%
- Flour, malt, starchUS$ 121 mn → US$ 95.8 mn↓-20.5%
- Salt, stone, cementUS$ 46.9 mn → US$ 39.1 mn↓-16.5%
- CopperUS$ 79.9 mn → US$ 70.3 mn↓-12.1%
- Vehicles and partsUS$ 43.4 mn → US$ 38.4 mn↓-11.7%
Opportunity: what this country buys from the world, and from India
The country’s own recorded imports in UN Comtrade, 2024. Chapters with the biggest gap between what it buys from the world and what it buys from India.
Our product guides that sell here
India’s exports of each product to this country, 2025-26.
The 20 biggest export lines
4-digit HS lines, 2025-26, with their Harmonized System descriptions.
What India buys from Malaysia
India’s imports from this country in 2025-26 by HS chapter, from TradeStat — this country can be your supplier too.
- India’s imports, 2025-26
- US$ 14.2 bn US$ 12.5 bn → US$ 14.2 bn
- India’s exports, 2025-26
- US$ 6.83 bn
- Trade balance
- −US$ 7.35 bn exports minus imports
- Change in imports
- +13%
The country at a glance
- Population
- 36.0 mn 2025
- GDP
- US$ 472.2 bn 2025
- GDP per person
- US$ 13,125 2025
- Imports (goods and services)
- US$ 308.9 bn 2025
Sources: TradeStat — Export Import Data Bank, Department of Commerce · UN Comtrade database (United Nations Statistics Division) · World Bank — World Development Indicators · Figures taken 29 October 2026.
What to send to Malaysia
All products → Free, with conditionsFarm produceNon-basmati riceHigh-volume staple sold mainly to Africa and Bangladesh. Export reopened in 2024–25, but contracts must now be registered with APEDA.HS1006.30Exports 2025-26US$ 5.86 bn ↓10.2%
 Free, with conditionsFarm produceBasmati riceIndia’s top agri export by value. Free to export, but every contract must be registered with APEDA first.HS1006.30Exports 2025-26US$ 5.67 bn ↓4.6%
 Free to exportFarm produceFresh onionBig-volume fresh export to Asia and the Gulf. Policy swings with domestic prices — check DGFT and CBIC before every season.HS0703.10Exports 2025-26US$ 430 mn ↓8.3%
 Free to exportFarm produceSpicesWhole, ground and blended spices. Spices Board registration (CRES) is compulsory; residue and ethylene oxide tests keep buyers.HS0904–0910Exports 2025-26US$ 3.12 bn ↓5.1%
 Free to exportMarineFrozen shrimpIndia’s top seafood export. Needs MPEDA registration and an EIC-approved plant; residue testing and US trade measures shape the business.HS0306.17Exports 2025-26US$ 5.61 bn ↑9.1%
 Free to exportProcessed foodProcessed foodSnacks, pickles, ready-to-eat meals, sauces, biscuits and mixes. FSSAI licence plus the buyer country’s labelling and registration rules.HS19–21Exports 2025-26US$ 4.19 bn ↑8.9%
 Free to exportEngineering goodsAuto parts and componentsOEM and aftermarket vehicle parts; the USA, Germany and Italy buy most, with strong demand in Latin America.HS8708Exports 2025-26US$ 7.64 bn ↑1.8%
 Free to exportPharma & chemicalsGeneric medicines (formulations)Tablets, capsules and injectables; every market needs product registration. The USA buys the most.HS3004Exports 2025-26US$ 21.9 bn ↓0.7%
More in South-East Asia
 CECASGDSingaporeSingaporeDuty-free trading hub for South-East Asia. Strict food licensing by SFA; big Indian community.From India 2025-26US$ 11.9 bn
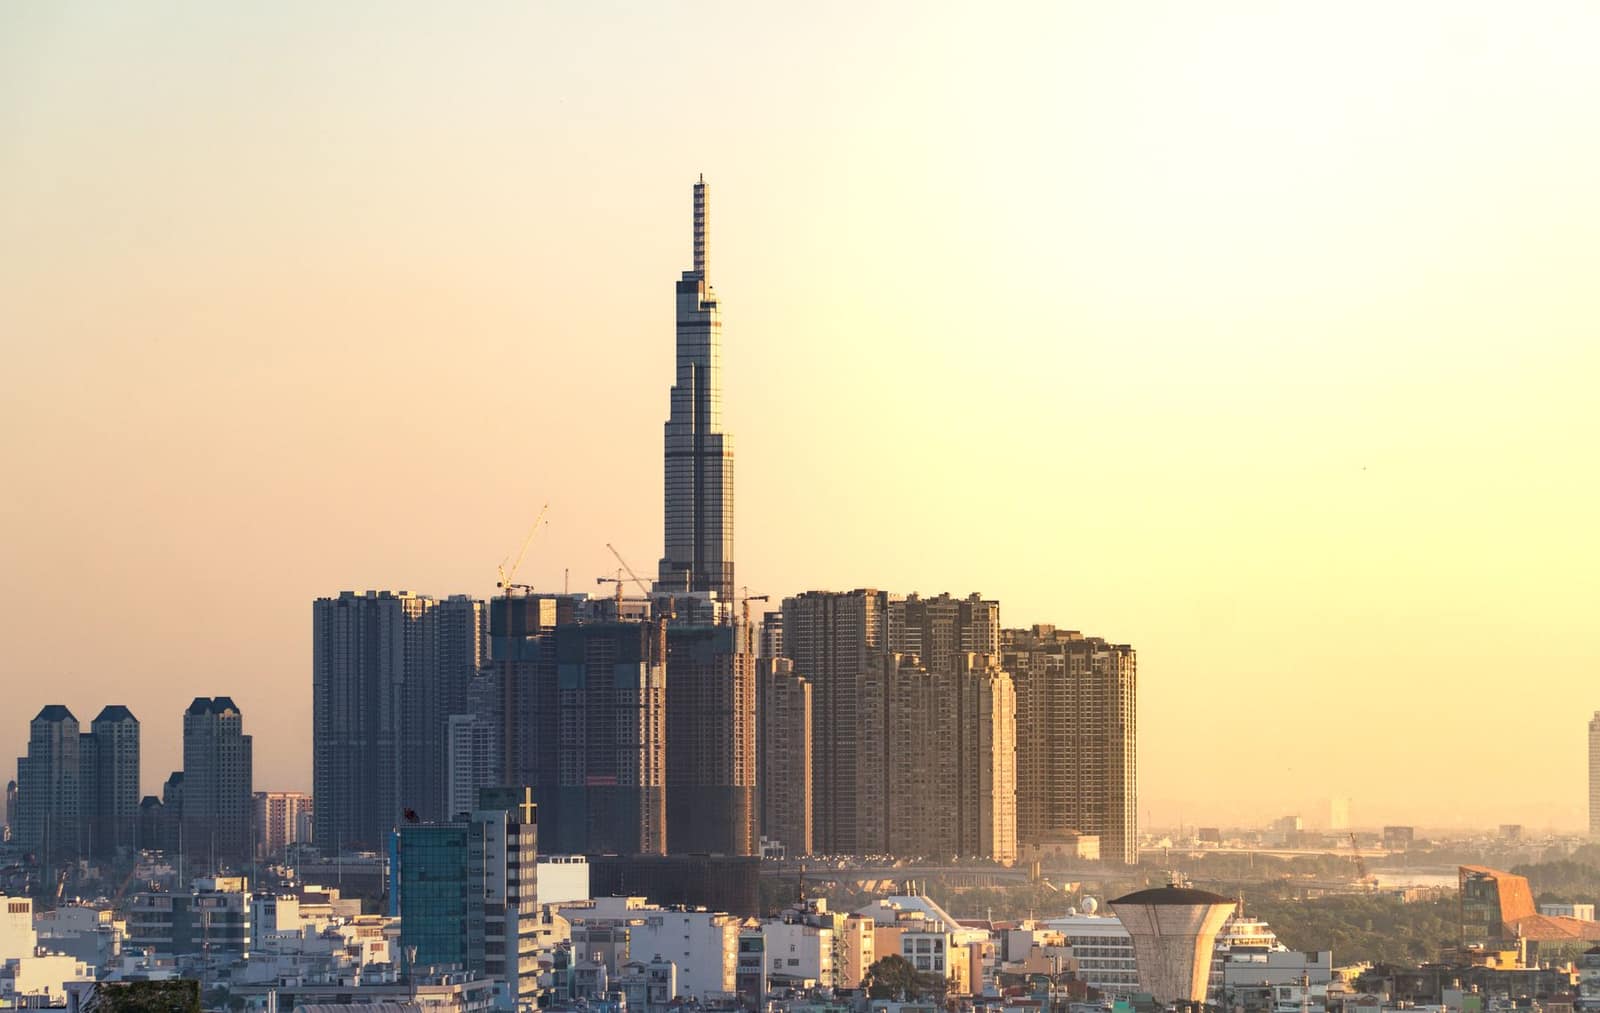 AITIGAVNDHanoiVietnamFast-growing manufacturing economy buying raw materials, yarn, steel, chemicals and feed ingredients from India.From India 2025-26US$ 6.67 bn
 AITIGAIDRJakartaIndonesiaWorld's fourth most populous country. Buys Indian vehicles, steel, chemicals, groundnuts and meat; halal and BPOM rules for food.From India 2025-26US$ 4.49 bn