

South-East Asia
Export to Vietnam
Fast-growing manufacturing economy buying raw materials, yarn, steel, chemicals and feed ingredients from India.
- Capital
- Hanoi
- Currency
- VND
- Trade agreement with India
- ASEAN–India Trade in Goods Agreement (AITIGA) 2010
- Main ports
- Ho Chi Minh City (Cat Lai), Cai Mep–Thi Vai, Hai Phong
Vietnam's factories make garments, footwear, electronics and furniture for the world, so it buys inputs: cotton and yarn, steel, chemicals, machinery parts, animal feed ingredients and seafood for processing. It is a business-to-business market more than a consumer market for Indian goods.
Vietnam gives reduced duties to Indian goods under AITIGA when you supply an AITIGA (Form AI) certificate of origin. The agreement is under review by India and ASEAN; confirm current status on commerce.gov.in.
What it buys from India
- Iron and steel, machinery and electrical parts
- Cotton, yarn and fabric
- Marine products, meat and animal feed ingredients
- Chemicals, plastics and medicines
Import rules on their side
- Fresh fruit and vegetables can enter only after Vietnam completes a pest risk analysis for that product from India; check with the Plant Protection Department.
- Imported food needs a product self-declaration or registration by the importer, and labels or sub-labels in Vietnamese.
- Medicines must be registered with Vietnam's Drug Administration before sale.
Practical tips
- Use an LC for new buyers; check the buyer's business registration and ask for references.
- English is not widely used in smaller firms — a local agent or interpreter helps.
- The Indian Embassy in Hanoi and Consulate in Ho Chi Minh City run buyer-seller meets; ask your export promotion council.
Trade data
India’s exports to Vietnam in numbers
From the Department of Commerce’s TradeStat (Indian financial years, April–March), the country’s imports from the world from UN Comtrade, and its basics from the World Bank.
- India’s exports here, 2025-26
- US$ 6.67 bn No. 17 of our 30 countries
- Change from 2024-25
- ↑ +22.8% US$ 5.43 bn → US$ 6.67 bn
- Share of all Indian exports
- 1.51%
- Its imports from the world
- US$ 358.8 bn 2022 · India’s share 1.99%
What India sells here most
By HS chapter, 2025-26. Change is against 2024-25.
What is rising and what is falling
Chapters where India sells at least US$ 5 million. Change from 2024-25 to 2025-26.
↑ High demand
- Iron and steelUS$ 108 mn → US$ 497 mn↑+358.3%
- Fuels and petroleum productsUS$ 24.5 mn → US$ 59.5 mn↑+142.8%
- VegetablesUS$ 18.2 mn → US$ 40.2 mn↑+120.8%
- Fruit and nutsUS$ 59.1 mn → US$ 126 mn↑+114%
- AluminiumUS$ 299 mn → US$ 525 mn↑+75.5%
- Feathers, artificial flowers, wigsUS$ 48.5 mn → US$ 74.3 mn↑+53.3%
- Fish and seafoodUS$ 342 mn → US$ 522 mn↑+52.6%
- Animal feed and food residuesUS$ 172 mn → US$ 261 mn↑+52.3%
↓ Low demand
- PlasticsUS$ 181 mn → US$ 102 mn↓-43.7%
- CottonUS$ 321 mn → US$ 239 mn↓-25.4%
- Vehicles and partsUS$ 308 mn → US$ 246 mn↓-20.2%
- Hides and skinsUS$ 88 mn → US$ 72.4 mn↓-17.7%
Opportunity: what this country buys from the world, and from India
The country’s own recorded imports in UN Comtrade, 2022. Chapters with the biggest gap between what it buys from the world and what it buys from India.
Our product guides that sell here
India’s exports of each product to this country, 2025-26.
The 20 biggest export lines
4-digit HS lines, 2025-26, with their Harmonized System descriptions.
What India buys from Vietnam
India’s imports from this country in 2025-26 by HS chapter, from TradeStat — this country can be your supplier too.
- India’s imports, 2025-26
- US$ 11.6 bn US$ 10.3 bn → US$ 11.6 bn
- India’s exports, 2025-26
- US$ 6.67 bn
- Trade balance
- −US$ 4.95 bn exports minus imports
- Change in imports
- +12.4%
The country at a glance
- Population
- 102 mn 2025
- GDP
- US$ 514.7 bn 2025
- GDP per person
- US$ 5,066 2025
- Imports (goods and services)
- US$ 474 bn 2025
Sources: TradeStat — Export Import Data Bank, Department of Commerce · UN Comtrade database (United Nations Statistics Division) · World Bank — World Development Indicators · Figures taken 29 October 2026.
What to send to Vietnam
All products →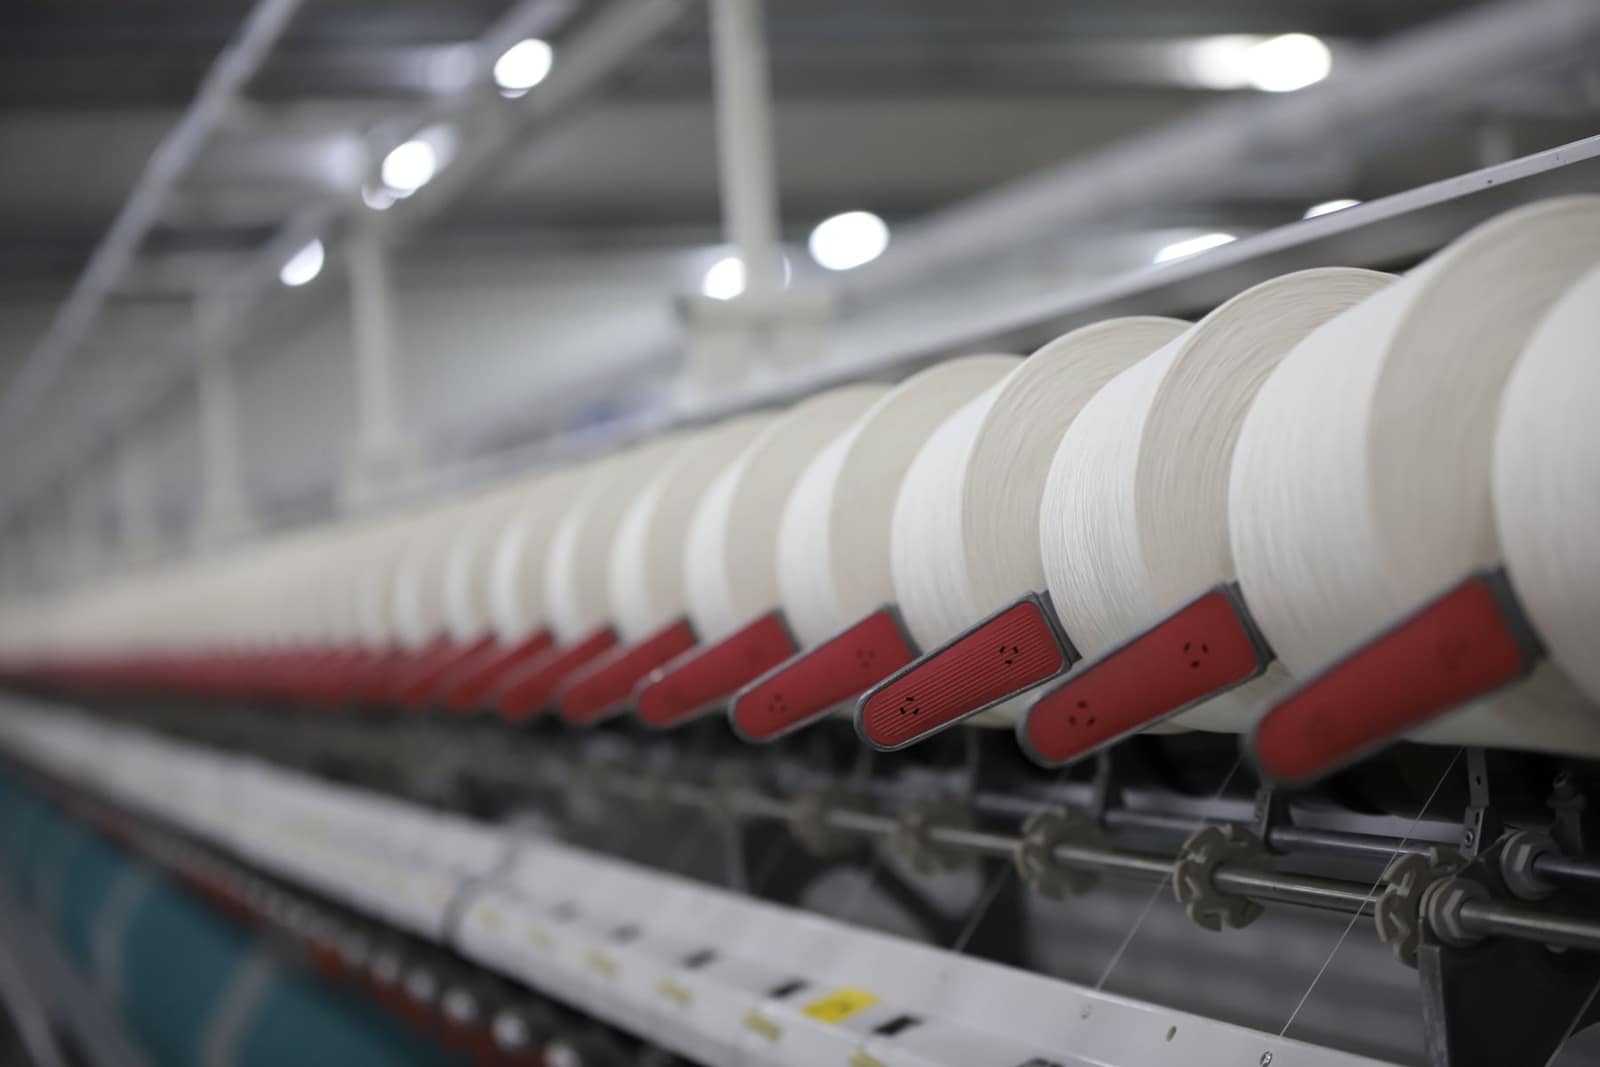 Free to exportTextiles & apparelCotton yarnBulk cotton yarn sold to weaving and knitting mills abroad; Bangladesh is by far the largest buyer.HS5205Exports 2025-26US$ 3.22 bn ↓4.1%
 Free to exportMarineFrozen shrimpIndia’s top seafood export. Needs MPEDA registration and an EIC-approved plant; residue testing and US trade measures shape the business.HS0306.17Exports 2025-26US$ 5.61 bn ↑9.1%
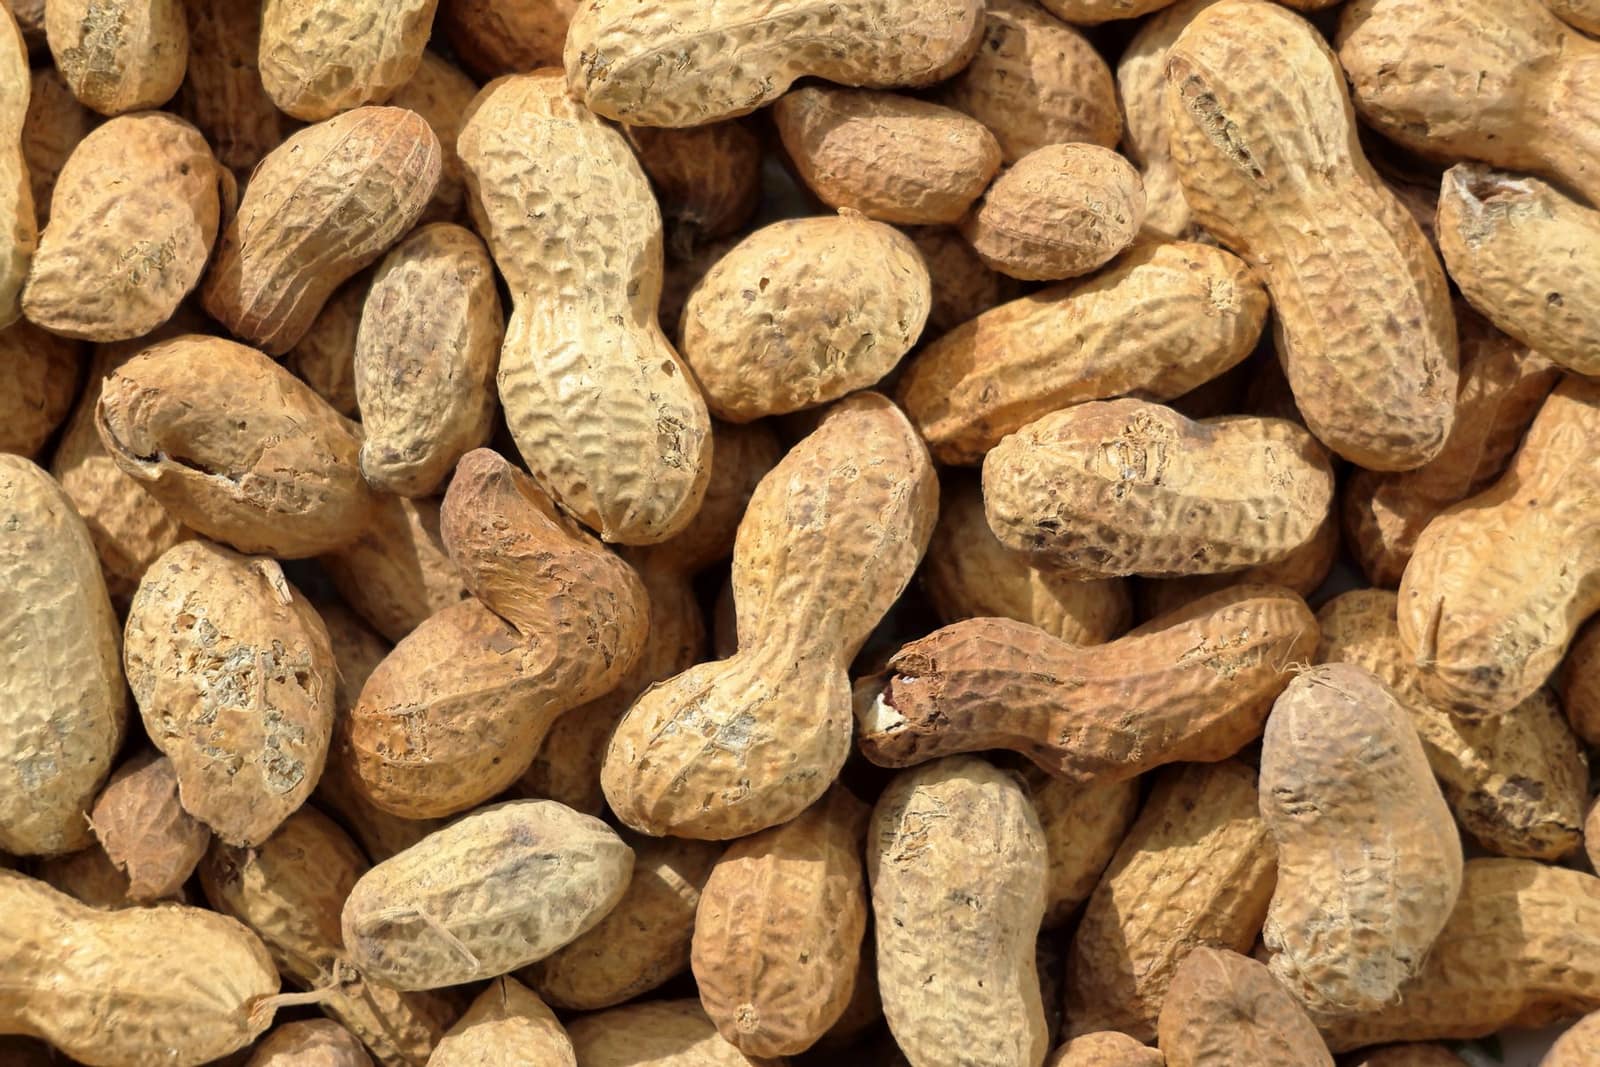 Free, with conditionsFarm produceGroundnut (peanut)Bold and Java kernels from Gujarat and Rajasthan, mainly to South-East Asia. APEDA registration and an aflatoxin certificate are compulsory.HS1202.42Exports 2025-26US$ 691 mn ↓13.1%
 Free to exportFarm produceSpicesWhole, ground and blended spices. Spices Board registration (CRES) is compulsory; residue and ethylene oxide tests keep buyers.HS0904–0910Exports 2025-26US$ 3.12 bn ↓5.1%
 Free to exportPharma & chemicalsGeneric medicines (formulations)Tablets, capsules and injectables; every market needs product registration. The USA buys the most.HS3004Exports 2025-26US$ 21.9 bn ↓0.7%
 Free to exportEngineering goodsAuto parts and componentsOEM and aftermarket vehicle parts; the USA, Germany and Italy buy most, with strong demand in Latin America.HS8708Exports 2025-26US$ 7.64 bn ↑1.8%
 Free to exportEngineering goodsIron and steel castingsGrey and ductile iron and steel castings from Kolhapur, Rajkot, Coimbatore and Howrah; the USA leads.HS7325Exports 2025-26US$ 1.25 bn ↑3.2%
 Free to exportProcessed foodCashew kernelsGraded kernels (W180–W450, splits, pieces) and roasted cashew. CEPCI is the council; Vietnam and the UAE are top buyers.HS0801.32Exports 2025-26US$ 379 mn ↑11.9%
More in South-East Asia
 CECASGDSingaporeSingaporeDuty-free trading hub for South-East Asia. Strict food licensing by SFA; big Indian community.From India 2025-26US$ 11.9 bn
 CECAMYRKuala LumpurMalaysiaMulti-ethnic market with a large Indian-origin community. Halal expectations for food; CECA and AITIGA both apply.From India 2025-26US$ 6.83 bn
 AITIGAIDRJakartaIndonesiaWorld's fourth most populous country. Buys Indian vehicles, steel, chemicals, groundnuts and meat; halal and BPOM rules for food.From India 2025-26US$ 4.49 bn