


South Asia
Export to Bangladesh
Big neighbour market for cotton, yarn, food and machinery. Mostly LC-based; land and sea routes.
- Capital
- Dhaka
- Currency
- BDT
- Trade agreement with India
- South Asian Free Trade Area (SAFTA); Asia-Pacific Trade Agreement (APTA) SAFTA since 2006
- Main ports
- Chattogram (sea), Mongla (sea), Benapole land port (opposite Petrapole, West Bengal)
Bangladesh's garment industry needs cotton, yarn, fabric, dyes and machinery, and India is a natural supplier. It also buys onions, rice, spices, sugar and other food, especially when its own harvest falls short. Trade moves by truck through land ports such as Petrapole–Benapole and by sea to Chattogram; land-port rules change often.

Both India and Bangladesh are SAFTA and APTA members, so many goods get reduced duty with a SAFTA certificate of origin — but each country keeps a "sensitive list" where no concession applies. Bangladesh also changes import rules often: since April 2025 it has barred yarn imports from India through land ports (NBR SRO 106/2025), so yarn must go by sea. Confirm current status with NBR and your buyer before shipping.
What it buys from India
- Cotton, cotton yarn and fabrics
- Cereals, onions, spices, sugar and other food
- Machinery, vehicles, auto parts and electrical goods
- Petroleum products, chemicals and steel
Import rules on their side
- Most imports are paid through a letter of credit or another bank-routed method opened by a Bangladeshi bank; the importer needs the bank's import registration.
- Products on BSTI's mandatory list (many foods and consumer goods) need BSTI certification or testing before release.
- Plant products need an Indian phytosanitary certificate; some products can only enter through named land ports.
Practical tips
- Insist on a confirmed LC for new buyers, or take ECGC cover. Delays in LC payment happen when dollar supply is tight.
- Before each shipment, check that your product is still allowed through the land port you plan to use — rules have changed several times since 2025.
- Truck queues at Petrapole can take days; perishables often move faster by rail or through other border points.
Trade data
India’s exports to Bangladesh in numbers
From the Department of Commerce’s TradeStat (Indian financial years, April–March), the country’s imports from the world from UN Comtrade, and its basics from the World Bank.
- India’s exports here, 2025-26
- US$ 10.6 bn No. 8 of our 30 countries
- Change from 2024-25
- ↓ -7.8% US$ 11.5 bn → US$ 10.6 bn
- Share of all Indian exports
- 2.4%
- Its imports from the world
- —
What India sells here most
By HS chapter, 2025-26. Change is against 2024-25.
What is rising and what is falling
Chapters where India sells at least US$ 5 million. Change from 2024-25 to 2025-26.
↑ High demand
- Cereals (rice, wheat, maize)US$ 378 mn → US$ 655 mn↑+73.1%
- Medicines and pharmaUS$ 78.6 mn → US$ 106 mn↑+35.4%
- OresUS$ 53.9 mn → US$ 62.2 mn↑+15.5%
- Salt, stone, cementUS$ 184 mn → US$ 203 mn↑+10.4%
↓ Low demand
- VegetablesUS$ 429 mn → US$ 158 mn↓-63.1%
- AluminiumUS$ 152 mn → US$ 94.5 mn↓-37.7%
- PlasticsUS$ 263 mn → US$ 178 mn↓-32.5%
- LeadUS$ 75.7 mn → US$ 54.6 mn↓-27.9%
- Soaps, detergents, waxesUS$ 73.6 mn → US$ 53.7 mn↓-27.1%
- Animal feed and food residuesUS$ 405 mn → US$ 301 mn↓-25.6%
- Iron and steel articlesUS$ 151 mn → US$ 114 mn↓-24.3%
- Inorganic chemicalsUS$ 108 mn → US$ 82.8 mn↓-23.1%
Our product guides that sell here
India’s exports of each product to this country, 2025-26.
The 20 biggest export lines
4-digit HS lines, 2025-26, with their Harmonized System descriptions.
What India buys from Bangladesh
India’s imports from this country in 2025-26 by HS chapter, from TradeStat — this country can be your supplier too.
- India’s imports, 2025-26
- US$ 1.78 bn US$ 2.01 bn → US$ 1.78 bn
- India’s exports, 2025-26
- US$ 10.6 bn
- Trade balance
- +US$ 8.81 bn exports minus imports
- Change in imports
- -11.2%
The country at a glance
- Population
- 176 mn 2025
- GDP
- US$ 456.3 bn 2025
- GDP per person
- US$ 2,597 2025
- Imports (goods and services)
- US$ 76.8 bn 2025
Sources: TradeStat — Export Import Data Bank, Department of Commerce · World Bank — World Development Indicators · Figures taken 29 October 2026.
What to send to Bangladesh
All products →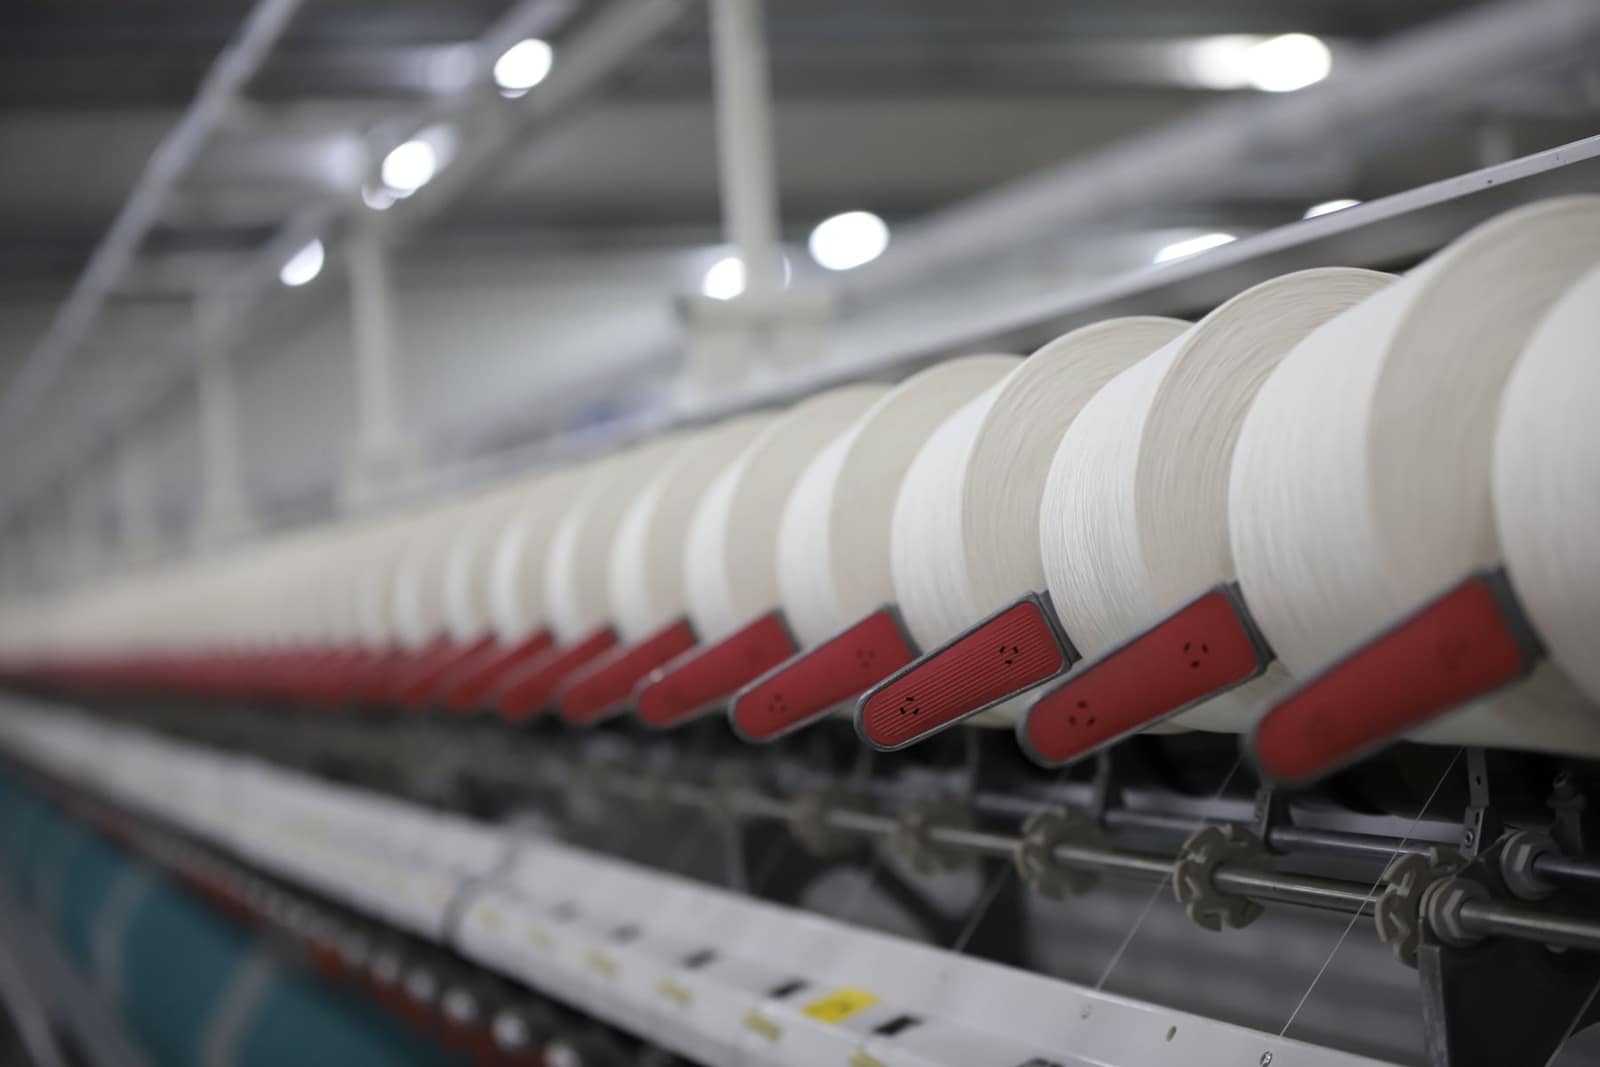 Free to exportTextiles & apparelCotton yarnBulk cotton yarn sold to weaving and knitting mills abroad; Bangladesh is by far the largest buyer.HS5205Exports 2025-26US$ 3.22 bn ↓4.1%
 Free to exportFarm produceFresh onionBig-volume fresh export to Asia and the Gulf. Policy swings with domestic prices — check DGFT and CBIC before every season.HS0703.10Exports 2025-26US$ 430 mn ↓8.3%
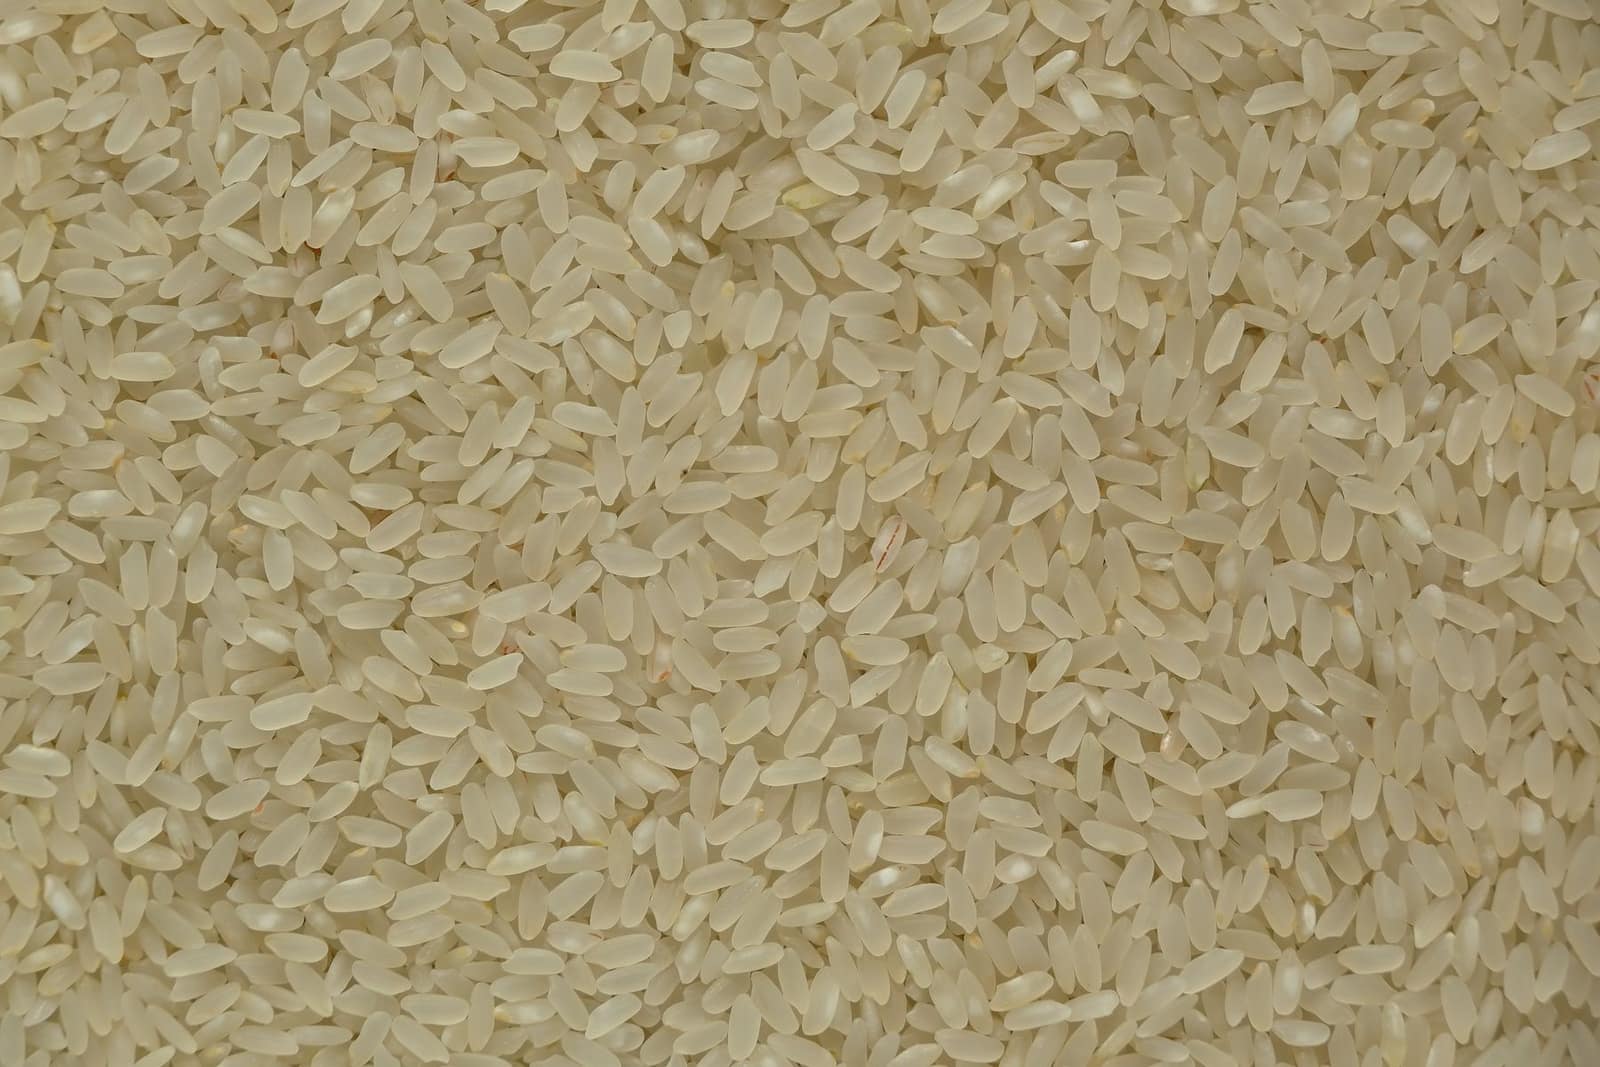 Free, with conditionsFarm produceNon-basmati riceHigh-volume staple sold mainly to Africa and Bangladesh. Export reopened in 2024–25, but contracts must now be registered with APEDA.HS1006.30Exports 2025-26US$ 5.86 bn ↓10.2%
 Free to exportFarm produceSpicesWhole, ground and blended spices. Spices Board registration (CRES) is compulsory; residue and ethylene oxide tests keep buyers.HS0904–0910Exports 2025-26US$ 3.12 bn ↓5.1%
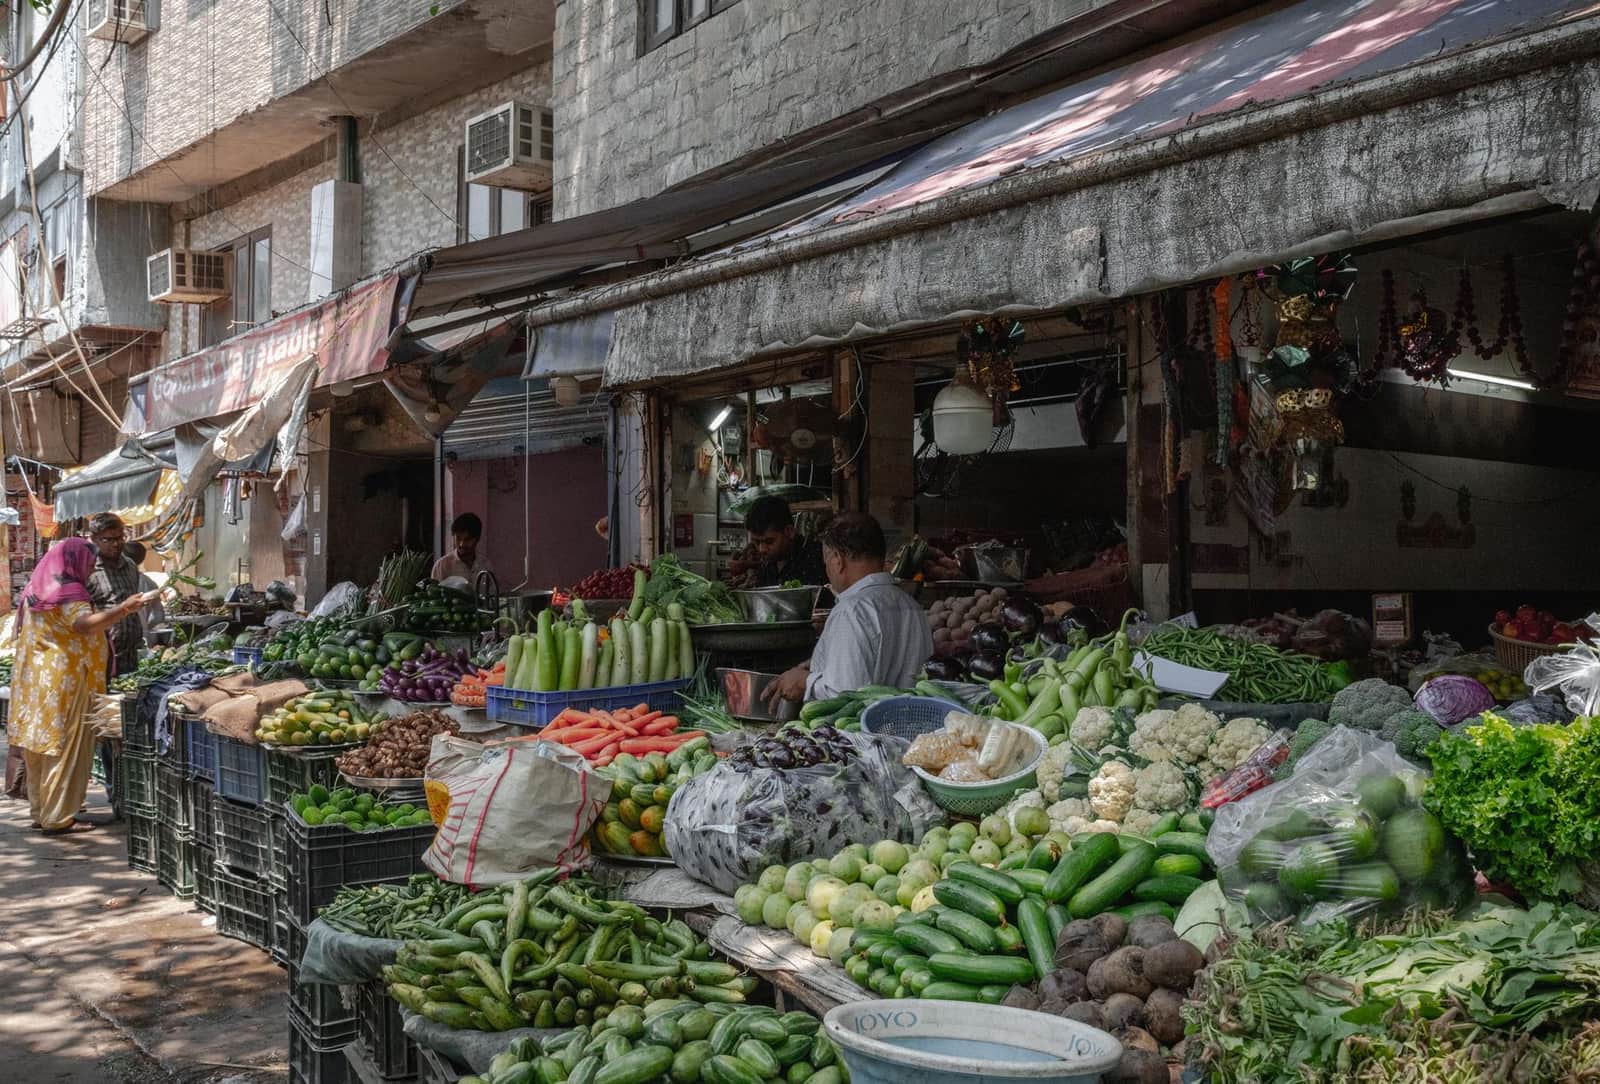 Free to exportFarm produceFresh vegetablesOkra, green chilli, drumstick, gourds and potatoes for Gulf and UK ethnic markets. Fast, perishable and residue-sensitive.HS07Exports 2025-26US$ 2.26 bn ↑3%
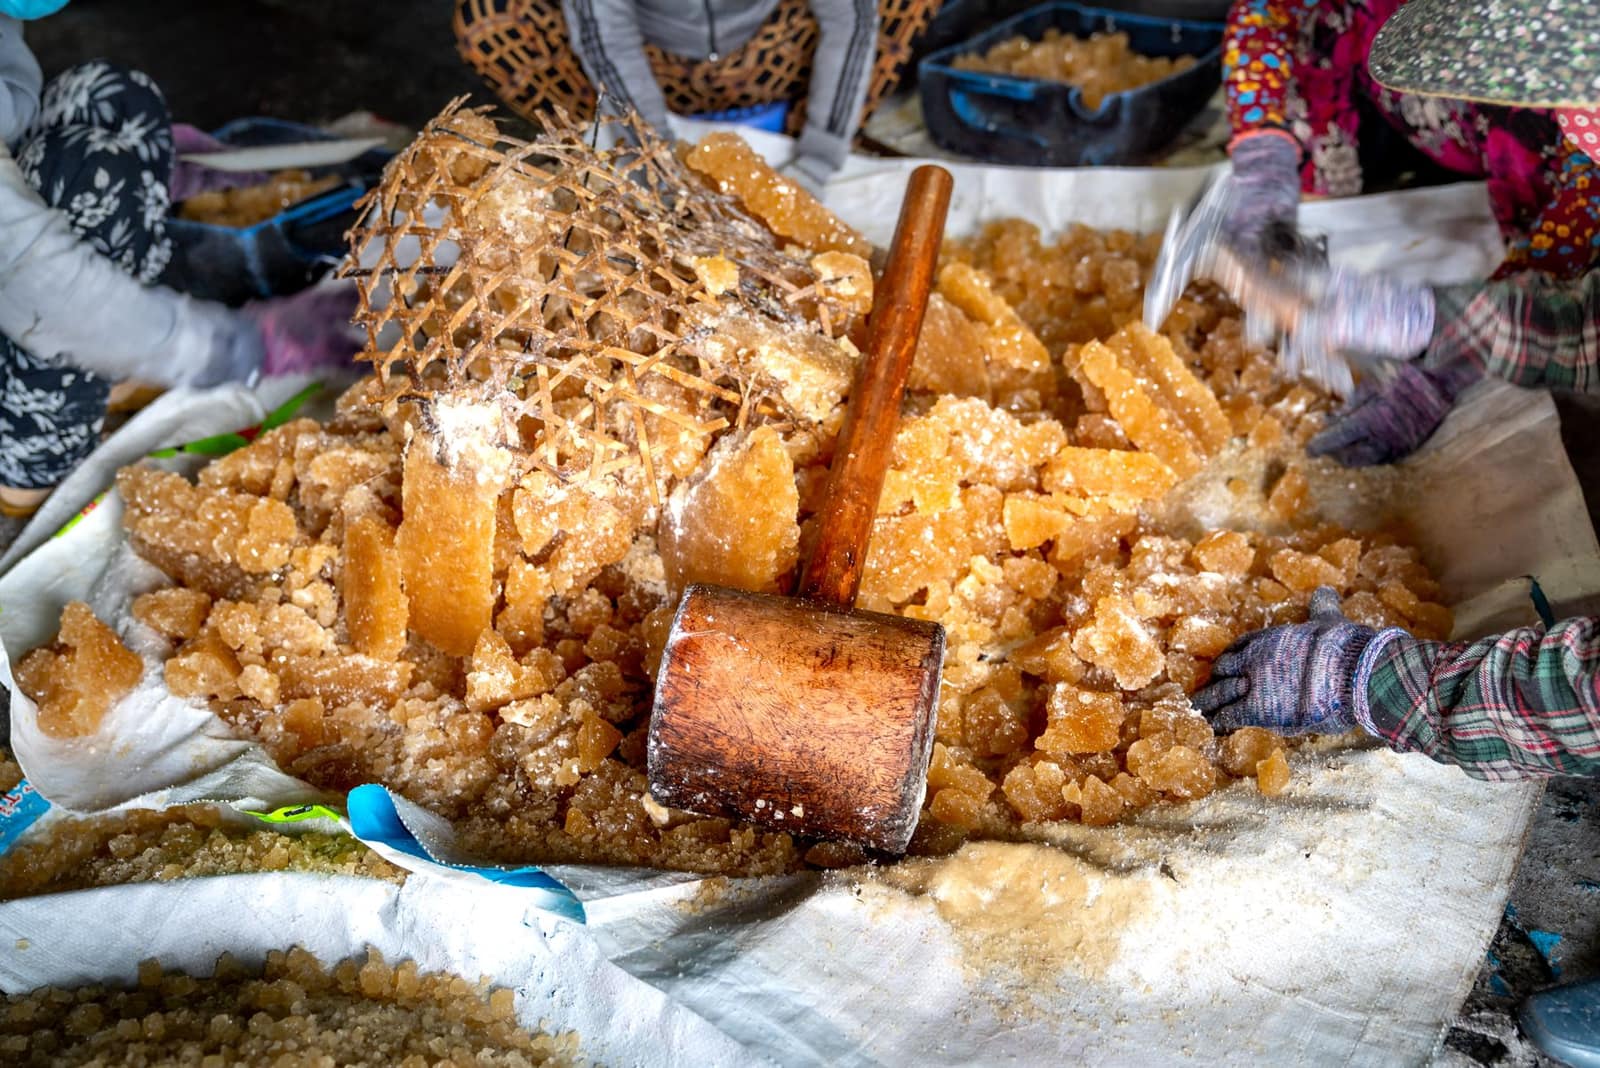 Free to exportProcessed foodJaggery (gur)Cane jaggery blocks and powder, mainly to Africa and Indonesia. Keep it separate from sugar, whose export is controlled.HS1701.13Exports 2025-26US$ 24.4 mn ↓55.9%
 Free to exportEngineering goodsAuto parts and componentsOEM and aftermarket vehicle parts; the USA, Germany and Italy buy most, with strong demand in Latin America.HS8708Exports 2025-26US$ 7.64 bn ↑1.8%
 Free to exportEngineering goodsPumpsAgricultural, domestic and industrial pumps from Coimbatore, Rajkot and Ahmedabad; the USA leads.HS8413Exports 2025-26US$ 1.6 bn ↑5.2%
More in South Asia
 SAFTANPRKathmanduNepalOpen land border, rupee payments and a market that relies on Indian goods — an easy first market by road.From India 2025-26US$ 7.45 bn
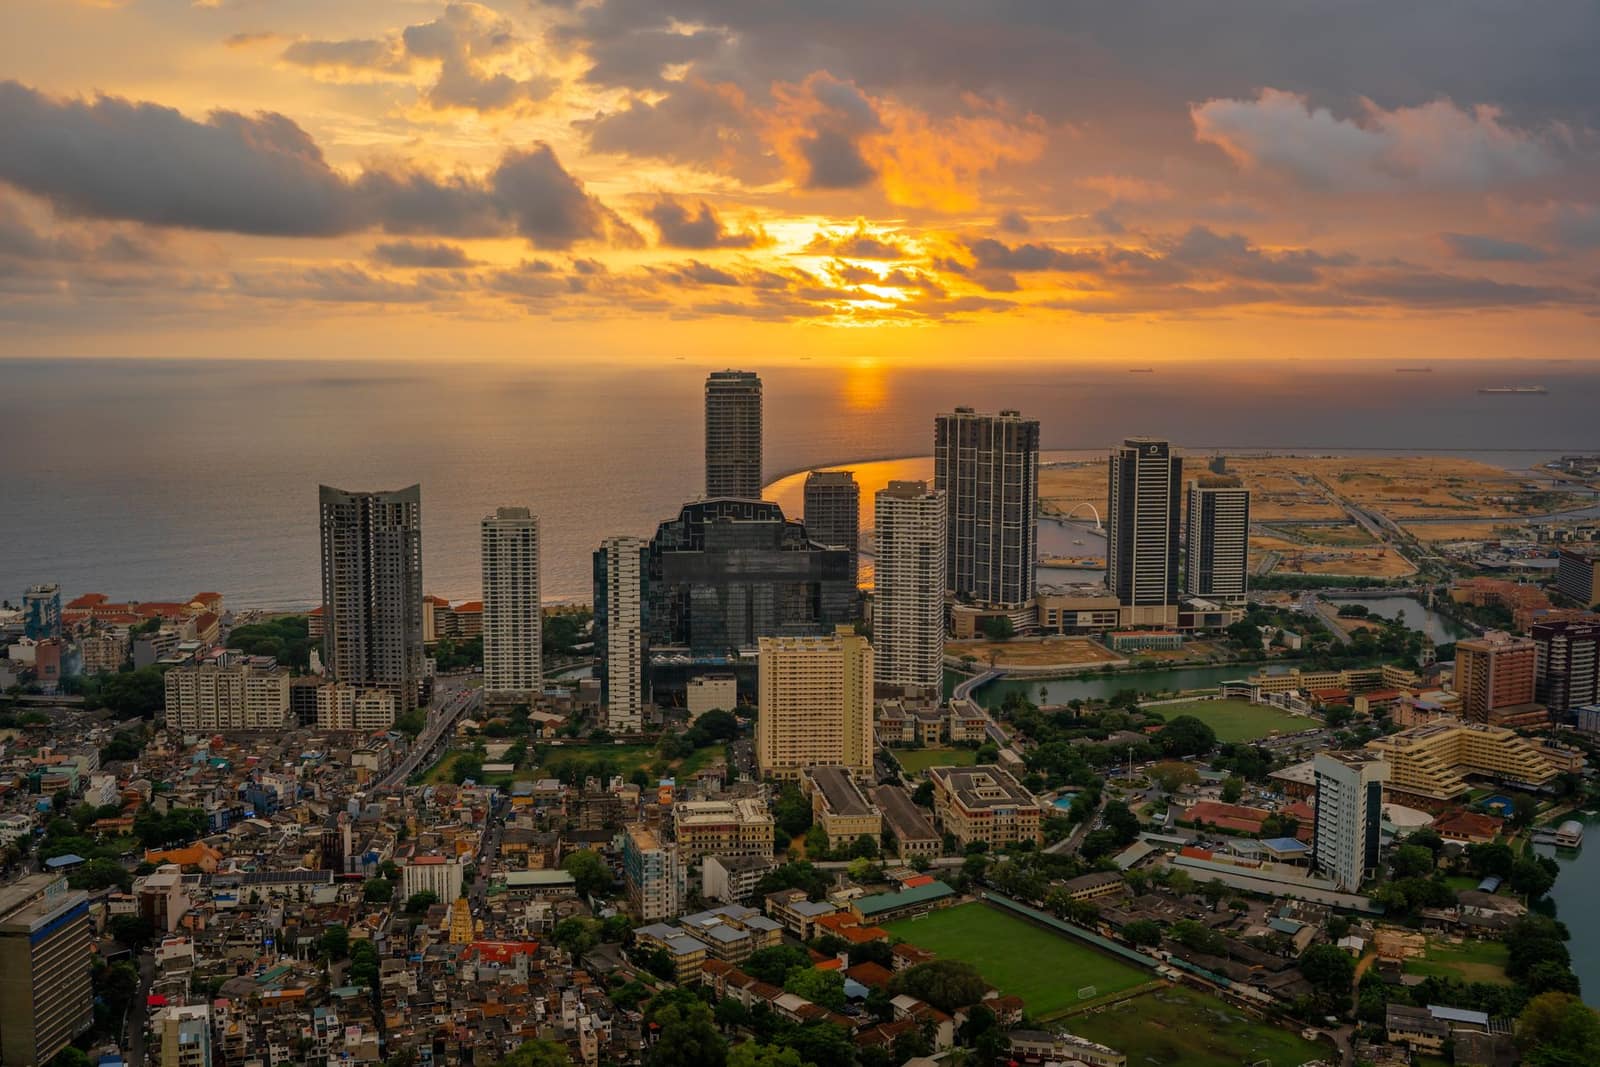 ISFTALKRSri Jayawardenepura Kotte (Colombo is the commercial capital)Sri LankaClose island market with India's oldest FTA. Buys food, medicines, vehicles, yarn and building materials.From India 2025-26US$ 5.52 bn
 SAFTABTNThimphuBhutanDuty-free, rupee-based neighbour market reached by road from West Bengal and Assam.From India 2025-26US$ 1.25 bn